


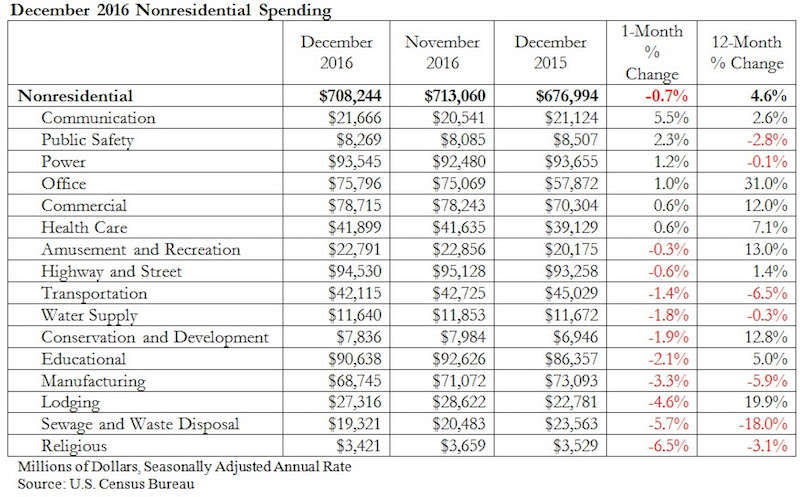
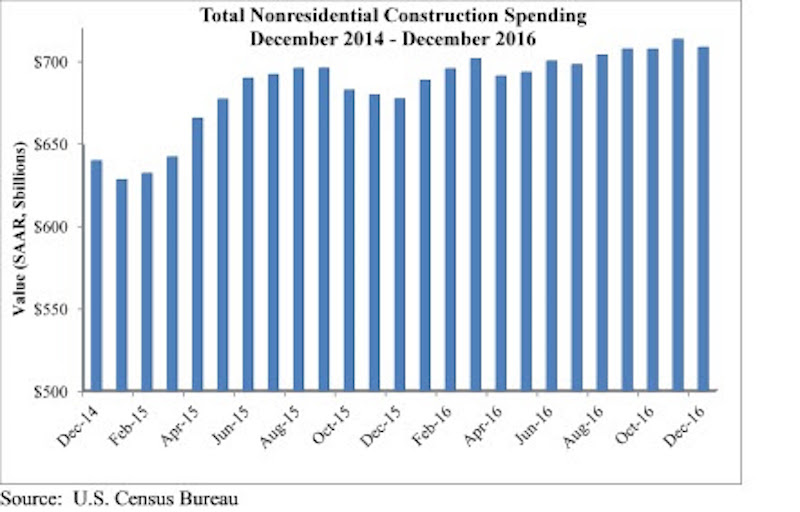
Nonresidential construction spending slipped 0.7 percent in the final month of 2016, but increased 4.6 percent over the previous year, according to analysis of U.S. Census Bureau data recently released by Associated Builders and Contractors (ABC). Nonresidential spending decreased from $713.1 billion in November to $708.2 billion in December on a seasonally adjusted, annualized basis.
Both November’s estimate ($713.1 billion) and October’s estimate ($707.1 billion) were upwardly revised by less than one-tenth of a percent. Private nonresidential spending remained flat for the month, while public nonresidential spending contracted 1.7 percent.
“Private spending growth, which has led nonresidential spending growth for months, remained flat in December and, as a result, the preexisting story of the industry remains fundamentally unchanged,” said ABC Chief Economist Anirban Basu in a release. “Public construction spending has been soft for many years and the December spending data merely served to extend that part of the tale. Spending in the sewage and waste disposal, transportation, and public safety sectors was particularly weak during the past 12 months. Private spending growth has been on-again, off-again for much of the year, so it is not a surprise that last month’s robust spending report was followed by a flat one.
“On the bright side, the architectural community became much busier in December, signaling an acceleration of commercial activity to come,” said Basu. “In addition, the new administration appears committed to fulfilling its campaign promises, including a pledge to step up infrastructure spending. This has asphalt, pavement and other infrastructure-intensive contractors expressing more confidence in their economic future than they have for many years. As such, the December data provide little insight into the future trajectory of nonresidential construction spending, which is set to improve markedly during the next six to 12 months.”
Related Stories

Market Data | Aug 4, 2020
7 must reads for the AEC industry today: August 4, 2020
Construction spending decreases for fourth consecutive month and 100% affordable housing development breaks ground in Mountain View.
Market Data | Aug 3, 2020
Construction spending decreases for fourth consecutive month in June
Association officials warn further contraction is likely unless federal government enacts prompt, major investment in infrastructure as state and local governments face deficits.

Market Data | Aug 3, 2020
6 must reads for the AEC industry today: August 3, 2020
The future is a number game for retail and restaurants and 5 reasons universities are renovating student housing.

Market Data | Jul 31, 2020
5 must reads for the AEC industry today: July 31, 2020
Vegas's newest resort and casino is packed with contactless technology and Mariott, Hilton, and IHG dominate the U.S. hotel construction pipeline.

Market Data | Jul 30, 2020
Marriott, Hilton, and IHG continue to dominate the U.S. hotel construction pipeline at Q2’20 close
Hilton’s Home2 Suites and IHG’s Holiday Inn Express continue to be the most prominent brands in the U.S. pipeline.

Market Data | Jul 30, 2020
7 must reads for the AEC industry today: July 30, 2020
Millennium Tower finally has a fix and construction costs decrease for the first time in 10 years.
Market Data | Jul 29, 2020
62% of metros shed construction jobs from June 2019 to June 2020 as Association calls for new infrastructure funding, other relief steps
New York City and Brockton-Bridgewater-Easton, Mass. have worst 12-month losses, while Austin and Walla Walla, Wash. top job gainers.

Market Data | Jul 29, 2020
6 must reads for the AEC industry today: July 29, 2020
The world's first net-zero airport and California utility adopts climate emergency declaration.

Market Data | Jul 28, 2020
For the fourth consecutive quarter, Los Angeles leads the U.S. hotel construction pipeline at the close of Q2’ 20
New York City continues to have the greatest number of projects under construction, with 106 projects/18,354 rooms.

Market Data | Jul 28, 2020
6 must reads for the AEC industry today: July 28, 2020
St. Petersburg Pier reconstruction completes and post-pandemic workplace design will not be the same for all.


