


According to an Associated Builders and Contractors analysis of U.S. Census Bureau data released today, national nonresidential construction spending rose 1.2% in February. Seasonally adjusted nonresidential spending totaled $773.8 billion, a 4.8% increase over the same time last year.
Private nonresidential spending fell 0.5% for the month and is only up 0.1% on a year-over-year basis. Public nonresidential spending is up 3.7% for the month and an impressive 12.1% for the year. Highway and street (+9.6%), water supply (+5.2%) and sewage and waste disposal (+5%) spending experienced the largest monthly increases in February, while religious (-4%) and transportation (-3.8%) spending experienced the largest decreases.
“A number of economic readings have come in weaker than expected of late, including retail sales and February employment,” said ABC Chief Economist Anirban Basu. “Now private nonresidential construction has effectively flatlined during the past year, with spending virtually unchanged on a year-ago basis despite higher materials costs. This suggests that the actual physical amount of construction put in place has declined in real terms during the past year.
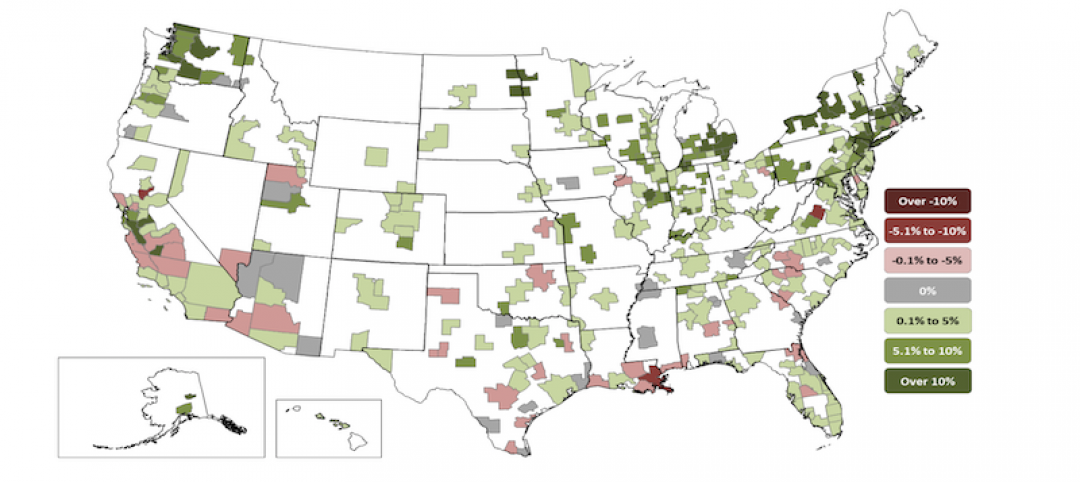
“As is often the case, it’s tempting to blame the weather,” said Basu. “It is absolutely true that the upper Midwest and New England were hit hard by precipitation and bitterly cold temperatures this winter, which undoubtedly suppressed some level of activity. However, softer growth in private nonresidential construction has been apparent for months. This is not a new phenomenon. Spending in the office, commercial and lodging categories was flat to declining in February.
“By contrast, public nonresidential construction spending was up sharply,” said Basu. “This strongly suggests that there is more at work than weather in terms of factors shaping the data. State and local government finances have continued to improve as the broader economy has expanded. America has generated job growth for 101 consecutive months, which has helped push income tax collections higher and unemployment insurance payments lower. Property values also have risen, as have sales tax collections.
“The standout is the highway and street category, which has experienced nearly 23% growth in spending on a year-over-year basis,” Basu added. “Policymakers also have been paying considerable attention to flood control (with conservation and development up 19% year over year) and water systems (with water supply up nearly 12%).”


Related Stories

Market Data | Aug 4, 2020
7 must reads for the AEC industry today: August 4, 2020
Construction spending decreases for fourth consecutive month and 100% affordable housing development breaks ground in Mountain View.
Market Data | Aug 3, 2020
Construction spending decreases for fourth consecutive month in June
Association officials warn further contraction is likely unless federal government enacts prompt, major investment in infrastructure as state and local governments face deficits.

Market Data | Aug 3, 2020
6 must reads for the AEC industry today: August 3, 2020
The future is a number game for retail and restaurants and 5 reasons universities are renovating student housing.

Market Data | Jul 31, 2020
5 must reads for the AEC industry today: July 31, 2020
Vegas's newest resort and casino is packed with contactless technology and Mariott, Hilton, and IHG dominate the U.S. hotel construction pipeline.

Market Data | Jul 30, 2020
Marriott, Hilton, and IHG continue to dominate the U.S. hotel construction pipeline at Q2’20 close
Hilton’s Home2 Suites and IHG’s Holiday Inn Express continue to be the most prominent brands in the U.S. pipeline.

Market Data | Jul 30, 2020
7 must reads for the AEC industry today: July 30, 2020
Millennium Tower finally has a fix and construction costs decrease for the first time in 10 years.
Market Data | Jul 29, 2020
62% of metros shed construction jobs from June 2019 to June 2020 as Association calls for new infrastructure funding, other relief steps
New York City and Brockton-Bridgewater-Easton, Mass. have worst 12-month losses, while Austin and Walla Walla, Wash. top job gainers.

Market Data | Jul 29, 2020
6 must reads for the AEC industry today: July 29, 2020
The world's first net-zero airport and California utility adopts climate emergency declaration.

Market Data | Jul 28, 2020
For the fourth consecutive quarter, Los Angeles leads the U.S. hotel construction pipeline at the close of Q2’ 20
New York City continues to have the greatest number of projects under construction, with 106 projects/18,354 rooms.

Market Data | Jul 28, 2020
6 must reads for the AEC industry today: July 28, 2020
St. Petersburg Pier reconstruction completes and post-pandemic workplace design will not be the same for all.


