

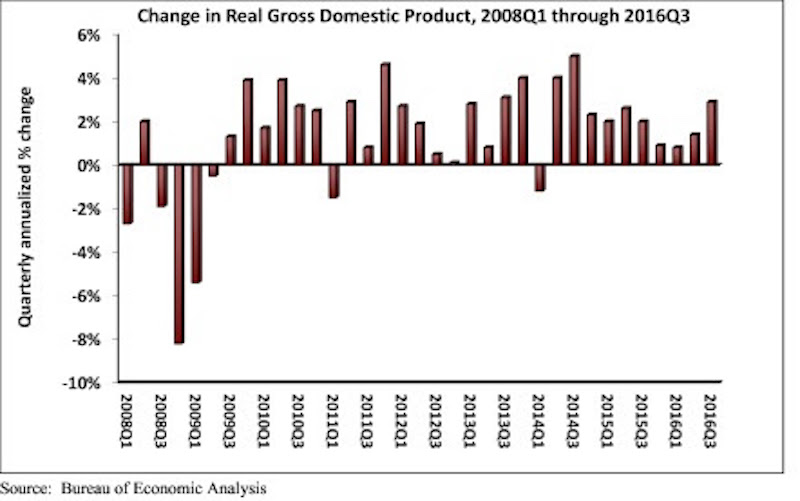
Real gross domestic product (GDP) expanded 2.9 percent on a seasonally adjusted annualized rate during the third quarter of 2016, according to an analysis of Bureau of Economic Analysis data released today by Associated Builders and Contractors (ABC). This follows a 1.4 percent increase during the second quarter and represents the tenth consecutive quarter of economic expansion.
Nonresidential fixed investment, a category closely aligned with construction and other forms of business investment, expanded at a 1.2 percent annualized rate during the third quarter after growing 1 percent during the second. Investment in structures led the way, increasing by 5.4 percent in the third quarter after falling 2.1 percent during the second. Investment in equipment fell 2.7 percent for the quarter, while investment in intellectual property products expanded 4 percent. Residential investment continued to fall, declining 6.2 percent in the third quarter after falling 7.7 percent during the second.
The following highlights emerged from today’s third quarter GDP release. All growth figures are presented as seasonally adjusted annualized rates:
- Personal consumption expenditures expanded 2.1 percent on an annualized basis during the third quarter of 2016 after growing 4.3 percent during the second quarter of 2016.
- Spending on goods rose 2.2 percent during the third quarter after expanding by 7.1 percent during the previous quarter.
- Real final sales of domestically produced output increased 2.3 percent in the third quarter after increasing 2.6 percent in the second.
- Federal government spending expanded 2.5 percent in the year’s third quarter after contracting during each of the prior two quarters.
- Nondefense government spending increased 3 percent during the quarter following an increase of 3.8 percent during the second.
- National defense spending grew by 2.1 percent during the third quarter after registering a 3.2 percent decline in the previous quarter.
- State and local government spending fell by 0.7 percent in the third quarter after falling 2.5 percent in the second quarter.
“The acceleration in real GDP growth was driven by a combination of factors, including an upturn in exports, a smaller decrease in state and local government spending and an upturn in federal government spending. One of the biggest impacts came from greater private inventory investment, likely in response to expectations for reasonably strong consumer spending. Growth in personal consumption expenditures was responsible for almost half of third quarter GDP growth. However, this build in inventories is likely to subtract from economic growth in future quarters, though not massively,” says ABC Chief Economist Anirban Basu.
“Third quarter growth was solid, but future quarters may not be as good,” Basu says. “The economy will have to deal with a number of headwinds going forward, including a stronger dollar, building inflationary pressures and higher interest rates. Consumer spending growth will continue to lead the recovery. While this will help support construction spending in certain categories, including distribution centers, nonresidential investment in structures is likely to expand only slowly in early 2017.”

Related Stories

Market Data | Aug 10, 2018
Construction material prices inch down in July
Nonresidential construction input prices increased fell 0.3% in July but are up 9.6% year over year.

Market Data | Aug 9, 2018
Projections reveal nonresidential construction spending to grow
AIA releases latest Consensus Construction Forecast.
Market Data | Aug 7, 2018
New supply's impact illustrated in Yardi Matrix national self storage report for July
The metro with the most units under construction and planned as a percent of existing inventory in mid-July was Nashville, Tenn.

Market Data | Aug 3, 2018
U.S. multifamily rents reach new heights in July
Favorable economic conditions produce a sunny summer for the apartment sector.

Market Data | Aug 2, 2018
Nonresidential construction spending dips in June
“The hope is that June’s construction spending setback is merely a statistical aberration,” said ABC Chief Economist Anirban Basu.

Market Data | Aug 1, 2018
U.S. hotel construction pipeline continues moderate growth year-over-year
The hotel construction pipeline has been growing moderately and incrementally each quarter.

Market Data | Jul 30, 2018
Nonresidential fixed investment surges in second quarter
Nonresidential fixed investment represented an especially important element of second quarter strength in the advance estimate.

Market Data | Jul 11, 2018
Construction material prices increase steadily in June
June represents the latest month associated with rapidly rising construction input prices.

Market Data | Jun 26, 2018
Yardi Matrix examines potential regional multifamily supply overload
Outsize development activity in some major metros could increase vacancy rates and stagnate rent growth.

Market Data | Jun 22, 2018
Multifamily market remains healthy – Can it be sustained?
New report says strong economic fundamentals outweigh headwinds.


