

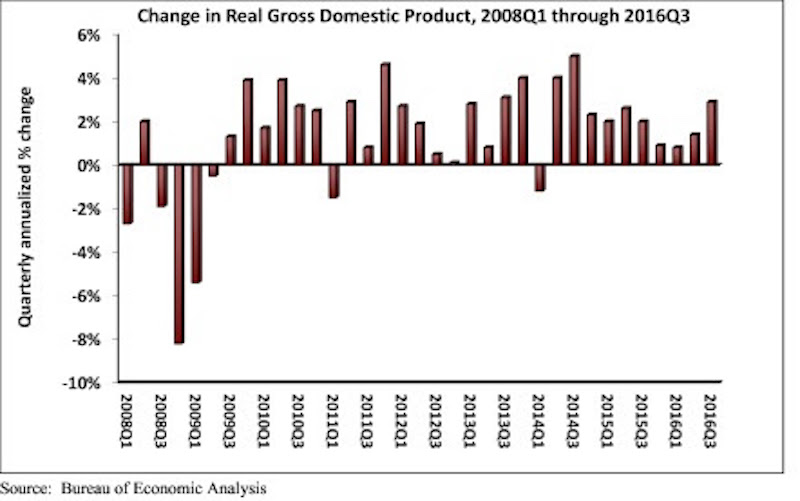
Real gross domestic product (GDP) expanded 2.9 percent on a seasonally adjusted annualized rate during the third quarter of 2016, according to an analysis of Bureau of Economic Analysis data released today by Associated Builders and Contractors (ABC). This follows a 1.4 percent increase during the second quarter and represents the tenth consecutive quarter of economic expansion.
Nonresidential fixed investment, a category closely aligned with construction and other forms of business investment, expanded at a 1.2 percent annualized rate during the third quarter after growing 1 percent during the second. Investment in structures led the way, increasing by 5.4 percent in the third quarter after falling 2.1 percent during the second. Investment in equipment fell 2.7 percent for the quarter, while investment in intellectual property products expanded 4 percent. Residential investment continued to fall, declining 6.2 percent in the third quarter after falling 7.7 percent during the second.
The following highlights emerged from today’s third quarter GDP release. All growth figures are presented as seasonally adjusted annualized rates:
- Personal consumption expenditures expanded 2.1 percent on an annualized basis during the third quarter of 2016 after growing 4.3 percent during the second quarter of 2016.
- Spending on goods rose 2.2 percent during the third quarter after expanding by 7.1 percent during the previous quarter.
- Real final sales of domestically produced output increased 2.3 percent in the third quarter after increasing 2.6 percent in the second.
- Federal government spending expanded 2.5 percent in the year’s third quarter after contracting during each of the prior two quarters.
- Nondefense government spending increased 3 percent during the quarter following an increase of 3.8 percent during the second.
- National defense spending grew by 2.1 percent during the third quarter after registering a 3.2 percent decline in the previous quarter.
- State and local government spending fell by 0.7 percent in the third quarter after falling 2.5 percent in the second quarter.
“The acceleration in real GDP growth was driven by a combination of factors, including an upturn in exports, a smaller decrease in state and local government spending and an upturn in federal government spending. One of the biggest impacts came from greater private inventory investment, likely in response to expectations for reasonably strong consumer spending. Growth in personal consumption expenditures was responsible for almost half of third quarter GDP growth. However, this build in inventories is likely to subtract from economic growth in future quarters, though not massively,” says ABC Chief Economist Anirban Basu.
“Third quarter growth was solid, but future quarters may not be as good,” Basu says. “The economy will have to deal with a number of headwinds going forward, including a stronger dollar, building inflationary pressures and higher interest rates. Consumer spending growth will continue to lead the recovery. While this will help support construction spending in certain categories, including distribution centers, nonresidential investment in structures is likely to expand only slowly in early 2017.”

Related Stories

Market Data | Apr 4, 2023
Nonresidential construction spending up 0.4% in February 2023
National nonresidential construction spending increased 0.4% in February, according to an Associated Builders and Contractors analysis of data published by the U.S. Census Bureau. On a seasonally adjusted annualized basis, nonresidential spending totaled $982.2 billion for the month, up 16.8% from the previous year.

Multifamily Housing | Mar 24, 2023
Average size of new apartments dropped sharply in 2022
The average size of new apartments in 2022 dropped sharply in 2022, as tracked by RentCafe. Across the U.S., the average new apartment size was 887 sf, down 30 sf from 2021, which was the largest year-over-year decrease.

Multifamily Housing | Mar 14, 2023
Multifamily housing rent rates remain flat in February 2023
Multifamily housing asking rents remained the same for a second straight month in February 2023, at a national average rate of $1,702, according to the new National Multifamily Report from Yardi Matrix. As the economy continues to adjust in the post-pandemic period, year-over-year growth continued its ongoing decline.

Contractors | Mar 14, 2023
The average U.S. contractor has 9.2 months worth of construction work in the pipeline, as of February 2023
Associated Builders and Contractors reported today that its Construction Backlog Indicator increased to 9.2 months in February, according to an ABC member survey conducted Feb. 20 to March 6. The reading is 1.2 months higher than in February 2022.

Industry Research | Mar 9, 2023
Construction labor gap worsens amid more funding for new infrastructure, commercial projects
The U.S. construction industry needs to attract an estimated 546,000 additional workers on top of the normal pace of hiring in 2023 to meet demand for labor, according to a model developed by Associated Builders and Contractors. The construction industry averaged more than 390,000 job openings per month in 2022.

Market Data | Mar 7, 2023
AEC employees are staying with firms that invest in their brand
Hinge Marketing’s latest survey explores workers’ reasons for leaving, and offers strategies to keep them in the fold.

Multifamily Housing | Feb 21, 2023
Multifamily housing investors favoring properties in the Sun Belt
Multifamily housing investors are gravitating toward Sun Belt markets with strong job and population growth, according to new research from Yardi Matrix. Despite a sharp second-half slowdown, last year’s nationwide $187 billion transaction volume was the second-highest annual total ever.

Contractors | Feb 14, 2023
The average U.S. contractor has nine months worth of construction work in the pipeline
Associated Builders and Contractors reports today that its Construction Backlog Indicator declined 0.2 months to 9.0 in January, according to an ABC member survey conducted Jan. 20 to Feb. 3. The reading is 1.0 month higher than in January 2022.

Office Buildings | Feb 9, 2023
Post-Covid Manhattan office market rebound gaining momentum
Office workers in Manhattan continue to return to their workplaces in sufficient numbers for many of their employers to maintain or expand their footprint in the city, according to a survey of more than 140 major Manhattan office employers conducted in January by The Partnership for New York City.

Giants 400 | Feb 9, 2023
New Giants 400 download: Get the complete at-a-glance 2022 Giants 400 rankings in Excel
See how your architecture, engineering, or construction firm stacks up against the nation's AEC Giants. For more than 45 years, the editors of Building Design+Construction have surveyed the largest AEC firms in the U.S./Canada to create the annual Giants 400 report. This year, a record 519 firms participated in the Giants 400 report. The final report includes 137 rankings across 25 building sectors and specialty categories.


