


Reed Construction Data has announced that the dollar value of construction starts in June, excluding residential activity, surged 34% versus May. The figures are in "current" dollars, meaning they are not adjusted for inflation.
The individual month of June, at $32.0 billion, was one of the strongest in Reed's entire database. To find a similarly high volume, one has to look back at June 2008, just before the Great Recession really took hold.
The one-third increase was an outsized gain, even after taking into account seasonality. Reed's long-term average May-to-June increase has been 4.5%. By comparison, May's month-to-month percentage change was +6.2% and April's -4.5%.
June starts this year compared with June of last year were +14.4%. The year-to-date level of total nonresidential construction starts, at $138 billion, was +2.4% when compared with the same January to June period of 2013.
Nonresidential construction accounts for a considerably larger share than of the total than residential work. The former's proportion of total put-in-place construction in the Census Bureau's May report was 62% versus the latter's 38%.
Reed's construction starts are leading indicators for the Census Bureau's capital investment or put-in-place series.
After a shockingly harsh winter, during which GDP contracted, the U.S. economy is back on an expansionary path with stock market indices near record highs and the unemployment rate close to the nation's 20-year average of 6.0%. Firms in the private sector are feeling more pressure to build new facilities.
The month-to-month leaders among major nonresidential construction categories were commercial +39%, and heavy engineering +34.7%. Institutional work was also up +3.6%, but to a much lesser degree. Industrial starts recorded a large percentage gain, but it came on top of a smaller dollar volume than the other three.
Commercial starts this June were even more impressive, +48.5%, when compared with June of last year. Engineering starts this June versus the same month last year were +13.7%. Institutional starts were -8.1%.
Year to date, heavy engineering (+13%) is out front, followed by institutional (+5.9%). Commercial starts (-14.5%) are still down from last year. Industrial work is 13.5%.
In commercial construction's two largest sub-categories, retail starts were +8.3% month to month, but -8.1% year to date, while private office building starts were +81.6% month to month and +29.6 year to date.
In the institutional category of work, school and college starts were +7.5% month to month and +9.7% year over year. Hospital/clinic starts moved in the opposite direction, -43.2% month to month and -12.3% year to date.
With the exception of dam/marine work, all the sub-categories of heavy engineering construction were ahead both month to month and year to date, with water and sewage work especially strong versus May, +40.2.
Institutional and heavy engineering work have especially close ties to government finances. Washington's deficit is diminishing, although the debt load remains high. At the state and local levels, the ongoing improvement in the overall economy is providing budgetary payoffs.
The nonresidential construction sector will derive benefits from taxes that are increasing naturally. Stronger employment and higher incomes lift income tax revenues; advances in consumer spending yield more sales taxes; and rising home prices translate into improved property taxes.
The value of construction starts each month is summarized from Reed's database of all active construction projects in the U.S. Missing project values are estimated with the help of RSMeans' building cost models.
See Reed Construction Data's full Construction Industry Snapshot here.

Related Stories
| Jan 7, 2011
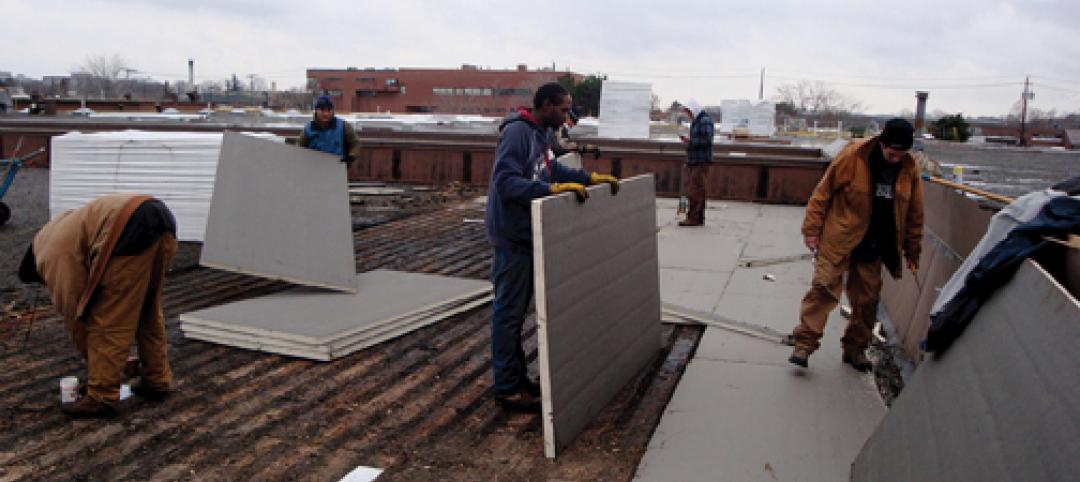
How Building Teams Choose Roofing Systems
A roofing survey emailed to a representative sample of BD+C’s subscriber list revealed such key findings as: Respondents named metal (56%) and EPDM (50%) as the roofing systems they (or their firms) employed most in projects. Also, new construction and retrofits were fairly evenly split among respondents’ roofing-related projects over the last couple of years.

| Jan 7, 2011
Total construction to rise 5.1% in 2011
Total U.S. construction spending will increase 5.1% in 2011. The gain from the end of 2010 to the end of 2011 will be 10%. The biggest annual gain in 2011 will be 10% for new residential construction, far above the 2-3% gains in all other construction sectors.
| Jan 7, 2011
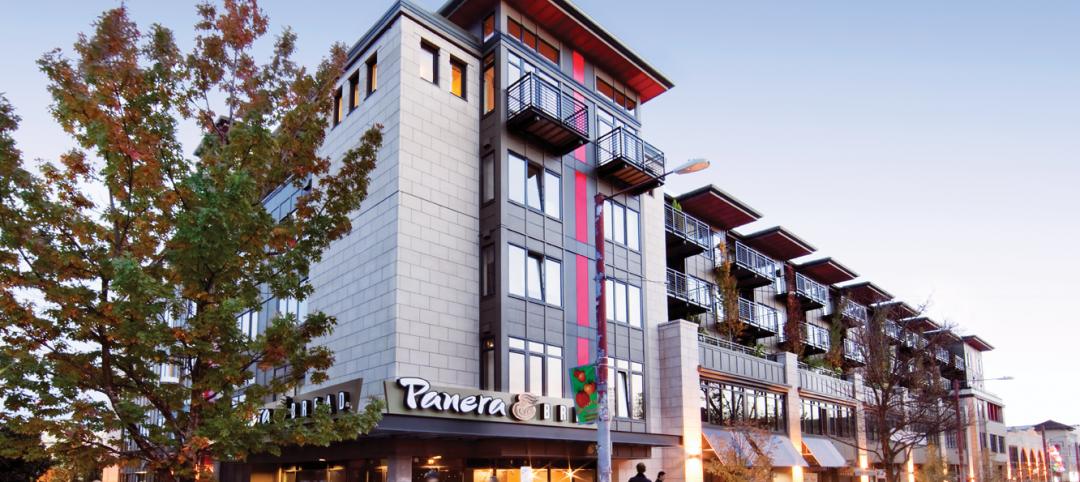
Mixed-Use on Steroids
Mixed-use development has been one of the few bright spots in real estate in the last few years. Successful mixed-use projects are almost always located in dense urban or suburban areas, usually close to public transportation. It’s a sign of the times that the residential component tends to be rental rather than for-sale.
| Jan 4, 2011
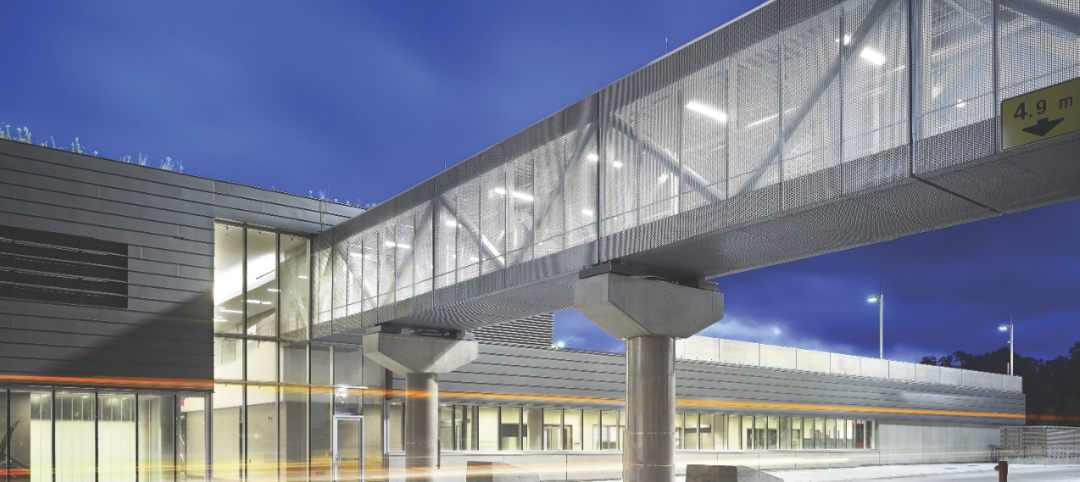
Product of the Week: Zinc cladding helps border crossing blend in with surroundings
Zinc panels provide natural-looking, durable cladding for an administrative building and toll canopies at the newly expanded Queenstown Plaza U.S.-Canada border crossing at the Niagara Gorge. Toronto’s Moriyama & Teshima Architects chose the zinc alloy panels for their ability to blend with the structures’ scenic surroundings, as well as for their low maintenance and sustainable qualities. The structures incorporate 14,000 sf of Rheinzink’s branded Angled Standing Seam and Reveal Panels in graphite gray.
| Jan 4, 2011
6 green building trends to watch in 2011
According to a report by New York-based JWT Intelligence, there are six key green building trends to watch in 2011, including: 3D printing, biomimicry, and more transparent and accurate green claims.
| Jan 4, 2011
LEED standards under fire in NYC
This year, for the first time, owners of 25,000 commercial properties in New York must report their buildings’ energy use to the city. However, LEED doesn’t measure energy use and costs, something a growing number of engineers, architects, and landlords insist must be done. Their concerns and a general blossoming of environmental awareness have spawned a host of rating systems that could test LEED’s dominance.
| Jan 4, 2011
LEED 2012: 10 changes you should know about
The USGBC is beginning its review and planning for the next version of LEED—LEED 2012. The draft version of LEED 2012 is currently in the first of at least two public comment periods, and it’s important to take a look at proposed changes to see the direction USGBC is taking, the plans they have for LEED, and—most importantly—how they affect you.
| Jan 4, 2011
California buildings: now even more efficient
New buildings in California must now be more sustainable under the state’s Green Building Standards Code, which took effect with the new year. CALGreen, the first statewide green building code in the country, requires new buildings to be more energy efficient, use less water, and emit fewer pollutants, among many other requirements. And they have the potential to affect LEED ratings.
| Jan 4, 2011
New Years resolutions for architects, urban planners, and real estate developers
Roger K. Lewis, an architect and a professor emeritus of architecture at the University of Maryland, writes in the Washington Post about New Years resolutions he proposes for anyone involved in influencing buildings and cities. Among his proposals: recycle and reuse aging or obsolete buildings instead of demolishing them; amend or eliminate out-of-date, obstructive, and overly complex zoning ordinances; and make all city and suburban streets safe for cyclists and pedestrians.


