


Reed Construction Data has announced that the dollar value of construction starts in June, excluding residential activity, surged 34% versus May. The figures are in "current" dollars, meaning they are not adjusted for inflation.
The individual month of June, at $32.0 billion, was one of the strongest in Reed's entire database. To find a similarly high volume, one has to look back at June 2008, just before the Great Recession really took hold.
The one-third increase was an outsized gain, even after taking into account seasonality. Reed's long-term average May-to-June increase has been 4.5%. By comparison, May's month-to-month percentage change was +6.2% and April's -4.5%.
June starts this year compared with June of last year were +14.4%. The year-to-date level of total nonresidential construction starts, at $138 billion, was +2.4% when compared with the same January to June period of 2013.
Nonresidential construction accounts for a considerably larger share than of the total than residential work. The former's proportion of total put-in-place construction in the Census Bureau's May report was 62% versus the latter's 38%.
Reed's construction starts are leading indicators for the Census Bureau's capital investment or put-in-place series.
After a shockingly harsh winter, during which GDP contracted, the U.S. economy is back on an expansionary path with stock market indices near record highs and the unemployment rate close to the nation's 20-year average of 6.0%. Firms in the private sector are feeling more pressure to build new facilities.
The month-to-month leaders among major nonresidential construction categories were commercial +39%, and heavy engineering +34.7%. Institutional work was also up +3.6%, but to a much lesser degree. Industrial starts recorded a large percentage gain, but it came on top of a smaller dollar volume than the other three.
Commercial starts this June were even more impressive, +48.5%, when compared with June of last year. Engineering starts this June versus the same month last year were +13.7%. Institutional starts were -8.1%.
Year to date, heavy engineering (+13%) is out front, followed by institutional (+5.9%). Commercial starts (-14.5%) are still down from last year. Industrial work is 13.5%.
In commercial construction's two largest sub-categories, retail starts were +8.3% month to month, but -8.1% year to date, while private office building starts were +81.6% month to month and +29.6 year to date.
In the institutional category of work, school and college starts were +7.5% month to month and +9.7% year over year. Hospital/clinic starts moved in the opposite direction, -43.2% month to month and -12.3% year to date.
With the exception of dam/marine work, all the sub-categories of heavy engineering construction were ahead both month to month and year to date, with water and sewage work especially strong versus May, +40.2.
Institutional and heavy engineering work have especially close ties to government finances. Washington's deficit is diminishing, although the debt load remains high. At the state and local levels, the ongoing improvement in the overall economy is providing budgetary payoffs.
The nonresidential construction sector will derive benefits from taxes that are increasing naturally. Stronger employment and higher incomes lift income tax revenues; advances in consumer spending yield more sales taxes; and rising home prices translate into improved property taxes.
The value of construction starts each month is summarized from Reed's database of all active construction projects in the U.S. Missing project values are estimated with the help of RSMeans' building cost models.
See Reed Construction Data's full Construction Industry Snapshot here.

Related Stories

Contractors | Sep 6, 2017
Following the money: G702 progress payment certifications
There is no single method of calculating progress payments, but the most common formula is the percentage of completion applied to the total contract price, less a retainage which is held by the owner until final acceptance of the project.

Multifamily Housing | Sep 5, 2017
Free WiFi, meeting rooms most popular business services amenities in multifamily developments
Complimentary, building-wide WiFi is more or less a given for marketing purposes in the multifamily arena.

Architects | Sep 1, 2017
5 reasons why AEC firms need to focus on employer branding
Not to be confused with the branding of your firm overall, your employer brand is defined by your reputation as a workplace.
Healthcare Facilities | Sep 1, 2017
Caring for caregivers
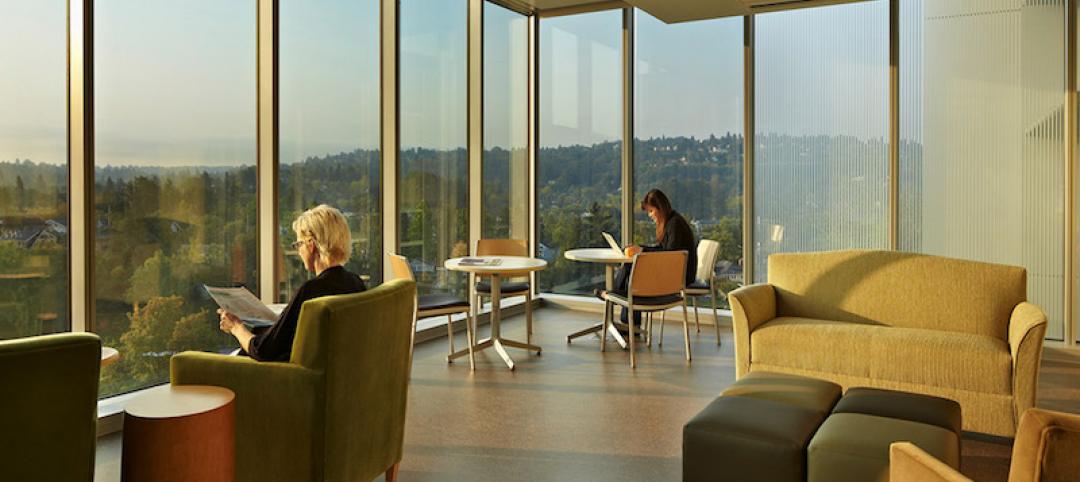
Many healthcare organizations are increasingly focused on designing amenities, policies, and workplaces to better support their clinicians, health providers, and administrators.

Architects | Aug 31, 2017
How Instagram is changing the design industry
The digital and physical worlds are colliding. How will social media platforms influence the way we design spaces?

Mixed-Use | Aug 30, 2017
A 50-acre waterfront redevelopment gets under way in Tampa
Nine architects, three interior designers, and nine contractors are involved in this $3 billion project.

AEC Tech | Aug 25, 2017
Software cornucopia: Jacksonville Jaguars’ new practice facility showcases the power of computational design
The project team employed Revit, Rhino, Grasshopper, Kangaroo, and a host of other software applications to design and build this uber-complex sports and entertainment facility.

Multifamily Housing | Aug 24, 2017
Storage units, lounges most popular indoor and outdoor amenities in multifamily developments
Tenants and condo owners crave extra space for their stuff. Most developers are happy to oblige.
Green | Aug 24, 2017
Business case for WELL still developing after first generation office fitouts completed
The costs ranged from 50 cents to $4 per sf, according to a ULI report.
Healthcare Facilities | Aug 24, 2017
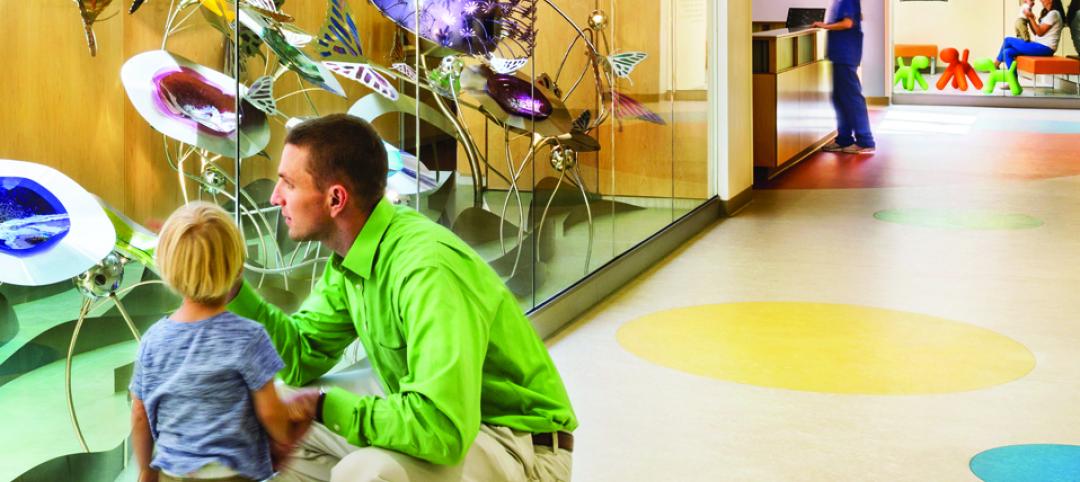
7 design elements for creating timeless pediatric health environments
A recently published report by Shepley Bulfinch presents pediatric healthcare environments as “incubators for hospital design innovation.”


