


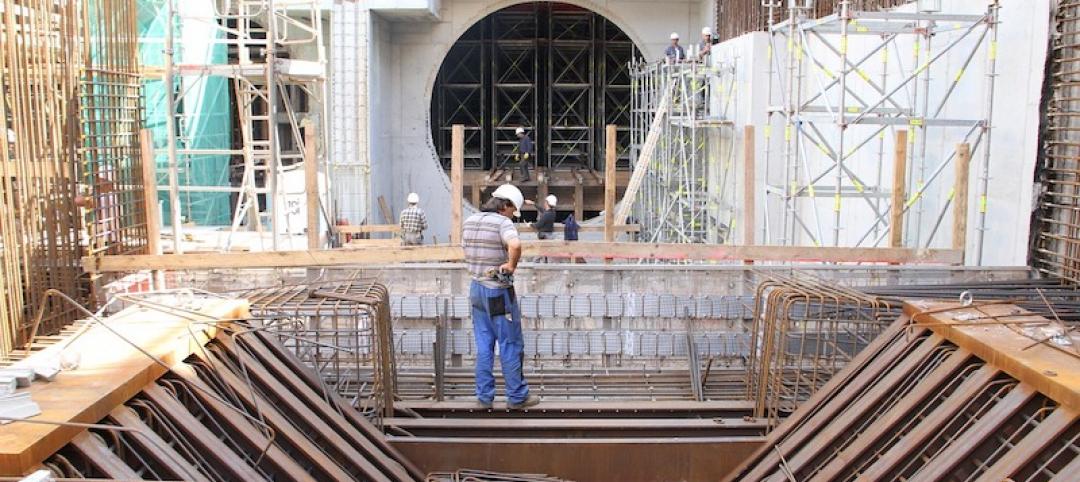
National nonresidential construction spending declined 1.8% in June, totaling $773.8 billion on a seasonally adjusted annualized basis—a 2.3% increase compared to the same time a year ago, according to an Associated Builders and Contractors analysis of U.S. Census Bureau data published today. Public nonresidential spending fell 3.7% in June, but is up 6.4% year over year, while private nonresidential spending fell 0.3% on a monthly basis and is up 0.4% from June 2018.
Among the 16 nonresidential construction spending categories tracked by the Census Bureau, seven experienced increases in monthly spending, although only the conservation and development (+3.8%) and commercial (+1.3%) categories increased by more than 1%. While spending in several categories fell for the month, significant decreases in the publicly driven educational (-6.5%) and highway and street (-6.3%) categories accounted for nearly all of the monthly decline.
“Like the balance of the U.S. economy, nonresidential construction spending appears to be softening, albeit gradually,” said ABC Chief Economist Anirban Basu. “Private nonresidential construction spending has been trending lower for several months, and segments like office and lodging are no longer the drivers of construction spending growth that they had been, likely due to growing concerns about market saturation.
“The dip in public construction may have been merely temporary, which is likely the case given the ongoing strength of state and local government finances.” said Basu. “And with the economy still adding substantial numbers of jobs, wages growing at or near a decade-high pace, consumers continuing to spend and property values remaining stable, local and state governments should continue to experience solid income, retail and real estate tax collections. All things being equal, that should help fuel infrastructure outlays, especially given still very low borrowing costs.
“While many observers continue to focus on issues such as trade disputes, high levels of corporate debt and asset prices that are susceptible to sharp declines, the U.S. construction industry’s most significant source of uncertainty may be the pending insolvency of the Highway Trust Fund,” said Basu. “That insolvency is now a mere two years away, and if policymakers fail to act expeditiously, state and local policymakers may choose to postpone certain projects given the rising uncertainty of federal funding. The highway/street and transportation categories are especially vulnerable to such dynamics.”


Related Stories

Market Data | Jun 23, 2020
7 must reads for the AEC industry today: June 23, 2020
Gyms are going bacnkrupt and leaving gaps in shopping centers and how hotels are trying to keep guests and employees safe.

Market Data | Jun 22, 2020
New House infrastructure package will provide needed investments in aging infrastructure, support economic recovery, and create jobs
The Moving Forward Act’s proposed $1.5 trillion in new investments will improve range of public infrastructure, creating needed demand for construction while making the economy more efficient.

Market Data | Jun 22, 2020
7 must reads for the AEC industry today: June 22, 2020
Construction employment rises from April to May in 45 states and the first building in the U.S. designed for post COVID-19 environment.
Market Data | Jun 22, 2020
Construction employment rises from April to May in 45 states, slips in 5
Rebound from April job losses reflects one-shot help from paycheck protection program loans and easing of stay-at-home orders, but cancellations and state and local deficits imply further cuts ahead.

Market Data | Jun 19, 2020
7 must reads for the AEC industry today: June 19, 2020
Brown University's first housing building in three decades and demand for family rentals expected to jump.
Market Data | Jun 18, 2020
New data shows construction activity returning to pre-coronavirus levels in many parts of the country
Association survey and data collected by Procore measure impacts of the pandemic, showing signs of a construction recovery, but labor shortages and project cancellations show industry needs federal help.

Market Data | Jun 18, 2020
AIA releases strategies and illustrations for reducing risk of COVID-19 in schools
For the 2020-21 school year, districts are facing the difficult task of determining if K-12 schools will reopen this fall.
Market Data | Jun 18, 2020
6 must reads for the AEC industry today: June 18, 2020
Northbrook's new cannabis dispensary and America's structural steel industry remains a success story.
Market Data | Jun 17, 2020
6 must reads for the AEC industry today: June 17, 2020
Santa Fe becomes the second city in the world to achieve LEED v4.1 and the megacity is dead.

Market Data | Jun 16, 2020
7 must reads for the AEC industry today: June 16, 2020
Tottenham Hotspur Stadium has its own brewery and workers want policy changes before they return to offices.


