


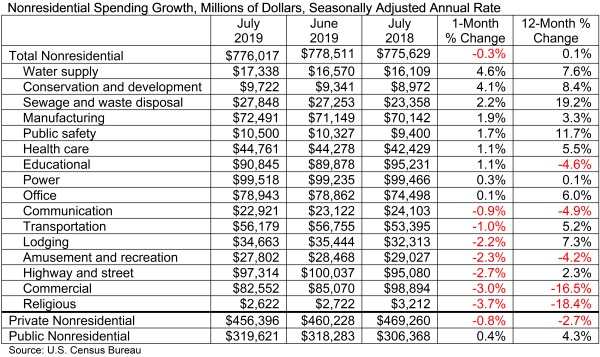
According to an Associated Builders and Contractors analysis of U.S. Census Bureau data published today, national nonresidential construction spending declined 0.3% in July totaling $776 billion on a seasonally adjusted annualized basis, and increased 0.1% compared to July 2018. The June 2019 estimates were revised upward from $773.8 billion to $778.5 billion.
In July, private nonresidential spending decreased 0.8% on a monthly basis and 2.7% on a yearly basis. Public nonresidential spending, however, increased 0.4% for the month and 4.3% for the year.
"While there is much discussion regarding the extent to which the U.S. economy has slowed and will slow going forward, these considerations have relatively little to do with today's nonresidential construction spending data," said ABC Chief Economist Anirban Basu. "Trends in nonresidential construction tend to lag the broader economy by a year to 18 months, which means that today's construction spending numbers reflect in large measure broader economic dynamics characterizing 2018. Last year was a good one for the economy, persuading many to move ahead with projects.
"Recent construction spending data, therefore, have been impacted by factors more closely related to the industry," said Basu. "For instance, the recent weakening in certain private construction segments, including office and lodging, are likely due to growing concerns regarding overbuilding and the somewhat higher cost of capital. Public spending growth, despite solid numbers in July, has been more erratic of late. This may have something to do with the looming insolvency of the Highway Trust Fund, which is expected in 2021 without congressional action. There is already evidence that some states have begun to postpone planning for new projects until there is more clarity regarding federal infrastructure spending, evident in the 2.7% spending decline observed in the highway and street category.
"Despite recent slow growth in construction spending, the U.S. construction industry has continued to expand employment levels during the past year," said Basu. "ABC’s Construction Backlog Indicator continues to show that the average contractor or subcontractor will remain busy over the near term. One of the reasons for relatively slow growth in nonresidential construction spending may simply be that the U.S. contracting community cannot deliver significantly more service in the context of worsening labor/skills shortages. In other words, nonresidential construction volume may already be near its peak potential supply. Given that, one wouldn't expect substantial growth in construction spending even in the context of significantly stronger economic growth."
Related Stories

Market Data | Apr 6, 2017
Architecture marketing: 5 tools to measure success
We’ve identified five architecture marketing tools that will help your firm evaluate if it’s on the track to more leads, higher growth, and broader brand visibility.

Market Data | Apr 3, 2017
Public nonresidential construction spending rebounds; overall spending unchanged in February
The segment totaled $701.9 billion on a seasonally adjusted annualized rate for the month, marking the seventh consecutive month in which nonresidential spending sat above the $700 billion threshold.

Market Data | Mar 29, 2017
Contractor confidence ends 2016 down but still in positive territory
Although all three diffusion indices in the survey fell by more than five points they remain well above the threshold of 50, which signals that construction activity will continue to be one of the few significant drivers of economic growth.

Market Data | Mar 24, 2017
These are the most and least innovative states for 2017
Connecticut, Virginia, and Maryland are all in the top 10 most innovative states, but none of them were able to claim the number one spot.

Market Data | Mar 22, 2017
After a strong year, construction industry anxious about Washington’s proposed policy shifts
Impacts on labor and materials costs at issue, according to latest JLL report.

Market Data | Mar 22, 2017
Architecture Billings Index rebounds into positive territory
Business conditions projected to solidify moving into the spring and summer.

Market Data | Mar 15, 2017
ABC's Construction Backlog Indicator fell to end 2016
Contractors in each segment surveyed all saw lower backlog during the fourth quarter, with firms in the heavy industrial segment experiencing the largest drop.

Market Data | Feb 28, 2017
Leopardo’s 2017 Construction Economics Report shows year-over-year construction spending increase of 4.2%
The pace of growth was slower than in 2015, however.

Market Data | Feb 23, 2017
Entering 2017, architecture billings slip modestly
Despite minor slowdown in overall billings, commercial/ industrial and institutional sectors post strongest gains in over 12 months.

Market Data | Feb 16, 2017
How does your hospital stack up? Grumman/Butkus Associates 2016 Hospital Benchmarking Survey
Report examines electricity, fossil fuel, water/sewer, and carbon footprint.


