


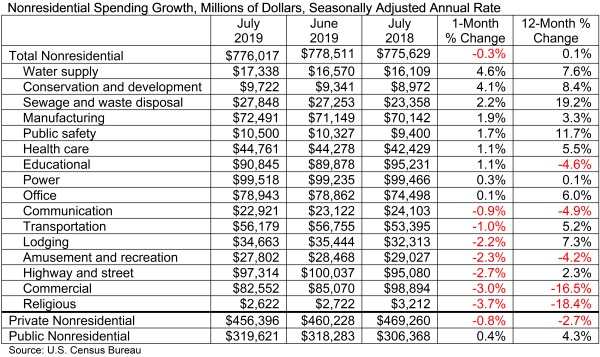
According to an Associated Builders and Contractors analysis of U.S. Census Bureau data published today, national nonresidential construction spending declined 0.3% in July totaling $776 billion on a seasonally adjusted annualized basis, and increased 0.1% compared to July 2018. The June 2019 estimates were revised upward from $773.8 billion to $778.5 billion.
In July, private nonresidential spending decreased 0.8% on a monthly basis and 2.7% on a yearly basis. Public nonresidential spending, however, increased 0.4% for the month and 4.3% for the year.
"While there is much discussion regarding the extent to which the U.S. economy has slowed and will slow going forward, these considerations have relatively little to do with today's nonresidential construction spending data," said ABC Chief Economist Anirban Basu. "Trends in nonresidential construction tend to lag the broader economy by a year to 18 months, which means that today's construction spending numbers reflect in large measure broader economic dynamics characterizing 2018. Last year was a good one for the economy, persuading many to move ahead with projects.
"Recent construction spending data, therefore, have been impacted by factors more closely related to the industry," said Basu. "For instance, the recent weakening in certain private construction segments, including office and lodging, are likely due to growing concerns regarding overbuilding and the somewhat higher cost of capital. Public spending growth, despite solid numbers in July, has been more erratic of late. This may have something to do with the looming insolvency of the Highway Trust Fund, which is expected in 2021 without congressional action. There is already evidence that some states have begun to postpone planning for new projects until there is more clarity regarding federal infrastructure spending, evident in the 2.7% spending decline observed in the highway and street category.
"Despite recent slow growth in construction spending, the U.S. construction industry has continued to expand employment levels during the past year," said Basu. "ABC’s Construction Backlog Indicator continues to show that the average contractor or subcontractor will remain busy over the near term. One of the reasons for relatively slow growth in nonresidential construction spending may simply be that the U.S. contracting community cannot deliver significantly more service in the context of worsening labor/skills shortages. In other words, nonresidential construction volume may already be near its peak potential supply. Given that, one wouldn't expect substantial growth in construction spending even in the context of significantly stronger economic growth."
Related Stories

Market Data | Jan 23, 2019
Architecture billings slow, but close 2018 with growing demand
AIA’s Architecture Billings Index (ABI) score for December was 50.4 compared to 54.7 in November.

Market Data | Jan 16, 2019
AIA 2019 Consensus Forecast: Nonresidential construction spending to rise 4.4%
The education, public safety, and office sectors will lead the growth areas this year, but AIA's Kermit Baker offers a cautious outlook for 2020.

Market Data | Dec 19, 2018
Brokers look forward to a commercial real estate market that mirrors 2018’s solid results
Respondents to a recent Transwestern poll expect flat to modest growth for rents and investment in offices, MOBs, and industrial buildings.

Market Data | Dec 19, 2018
When it comes to economic clout, New York will far outpace other U.S. metros for decades to come
But San Jose, Calif., is expected to have the best annual growth rate through 2035, according to Oxford Economics’ latest Global Cities report.

Market Data | Dec 19, 2018
Run of positive billings continues at architecture firms
November marked the fourteenth consecutive month of increasing demand for architectural firm services.

Market Data | Dec 5, 2018
ABC predicts construction sector will remain strong in 2019
Job growth, high backlog and healthy infrastructure investment all spell good news for the industry.

Market Data | Dec 4, 2018
Nonresidential spending rises modestly in October
Thirteen out of 16 subsectors are associated with year-over-year increases.

Market Data | Nov 20, 2018
Construction employment rises from October 2017 to October 2018 in 44 states and D.C.
Texas has biggest annual job increase while New Jersey continues losses; Iowa, Florida and California have largest one-month gains as Mississippi and Louisiana trail.

Market Data | Nov 15, 2018
Architecture firm billings continue to slow, but remain positive in October
Southern region reports decline in billings for the first time since June 2012.

Market Data | Nov 14, 2018
A new Joint Center report finds aging Americans less prepared to afford housing
The study foresees a significant segment of seniors struggling to buy or rent on their own or with other people.


