


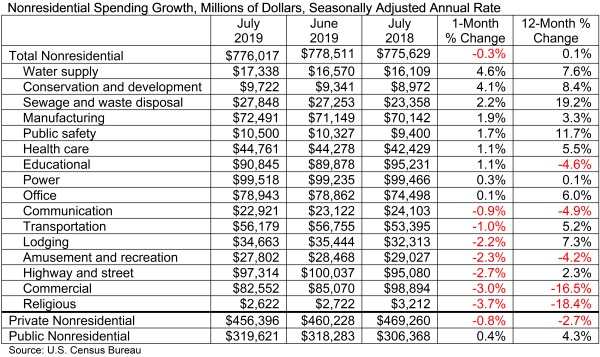
According to an Associated Builders and Contractors analysis of U.S. Census Bureau data published today, national nonresidential construction spending declined 0.3% in July totaling $776 billion on a seasonally adjusted annualized basis, and increased 0.1% compared to July 2018. The June 2019 estimates were revised upward from $773.8 billion to $778.5 billion.
In July, private nonresidential spending decreased 0.8% on a monthly basis and 2.7% on a yearly basis. Public nonresidential spending, however, increased 0.4% for the month and 4.3% for the year.
"While there is much discussion regarding the extent to which the U.S. economy has slowed and will slow going forward, these considerations have relatively little to do with today's nonresidential construction spending data," said ABC Chief Economist Anirban Basu. "Trends in nonresidential construction tend to lag the broader economy by a year to 18 months, which means that today's construction spending numbers reflect in large measure broader economic dynamics characterizing 2018. Last year was a good one for the economy, persuading many to move ahead with projects.
"Recent construction spending data, therefore, have been impacted by factors more closely related to the industry," said Basu. "For instance, the recent weakening in certain private construction segments, including office and lodging, are likely due to growing concerns regarding overbuilding and the somewhat higher cost of capital. Public spending growth, despite solid numbers in July, has been more erratic of late. This may have something to do with the looming insolvency of the Highway Trust Fund, which is expected in 2021 without congressional action. There is already evidence that some states have begun to postpone planning for new projects until there is more clarity regarding federal infrastructure spending, evident in the 2.7% spending decline observed in the highway and street category.
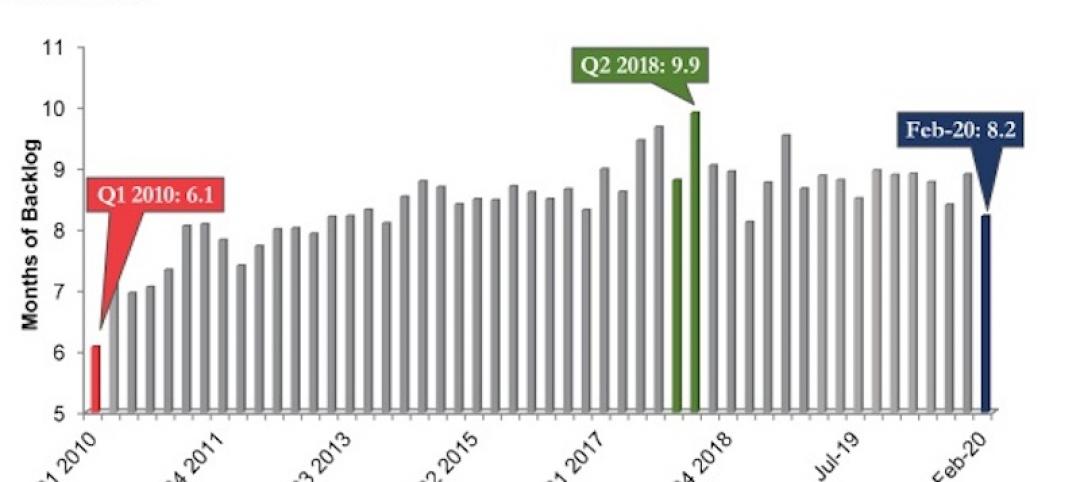
"Despite recent slow growth in construction spending, the U.S. construction industry has continued to expand employment levels during the past year," said Basu. "ABC’s Construction Backlog Indicator continues to show that the average contractor or subcontractor will remain busy over the near term. One of the reasons for relatively slow growth in nonresidential construction spending may simply be that the U.S. contracting community cannot deliver significantly more service in the context of worsening labor/skills shortages. In other words, nonresidential construction volume may already be near its peak potential supply. Given that, one wouldn't expect substantial growth in construction spending even in the context of significantly stronger economic growth."
Related Stories

Market Data | Apr 23, 2020
Construction Contractor Confidence plummets in February
As of February 2020, fewer than 30% of contractors expected their sales to increase over the next six months.

Market Data | Apr 23, 2020
5 must reads for the AEC industry today: April 23, 2020
The death of the department store and how to return to work when the time comes.
Market Data | Apr 22, 2020
6 must reads for the AEC industry today: April 22, 2020
Repurposed containers can be used as rapid response airborne infection isolation rooms and virtual site visits help control infection on project sites.
Market Data | Apr 21, 2020
ABC's Construction Backlog Indicator down in February
Backlog for firms working in the infrastructure segment rose by 1.3 months in February while backlog for commercial and institutional and heavy industrial firms declined by 0.6 months and 0.7 months, respectively.

Market Data | Apr 21, 2020
5 must reads for the AEC industry today: April 21, 2020
IoT system helps contractors keep their distance and the multifamily market flattens.

Market Data | Apr 20, 2020
6 must reads for the AEC industry today: April 20, 2020
The continent's tallest living wall and NMHC survey shows significant delays in apartment construction.

Market Data | Apr 17, 2020
Construction employment declines in 20 states and D.C. in March, in line with industry survey showing growing job losses for the sector
New monthly job loss data foreshadows more layoffs amid project cancellations and state cutbacks in road projects as association calls for more small business relief and immediate aid for highway funding.

Market Data | Apr 17, 2020
5 must reads for the AEC industry today: April 17, 2020
Meet the 'AEC outsiders' pushing the industry forward and the world's largest Living Building.

Market Data | Apr 16, 2020
5 must reads for the AEC industry today: April 16, 2020
The SMPS Foundation and Building Design+Construction are studying the impact of the coronavirus pandemic on the ability to attain and retain clients and conduct projects and Saks Fifth Avenue plans a sanitized post-coronavirus opening.

Market Data | Apr 15, 2020
5 must reads for the AEC industry today: April 15, 2020
Buildings as "open source platforms" and 3D printing finds its grove producing face shields.


