


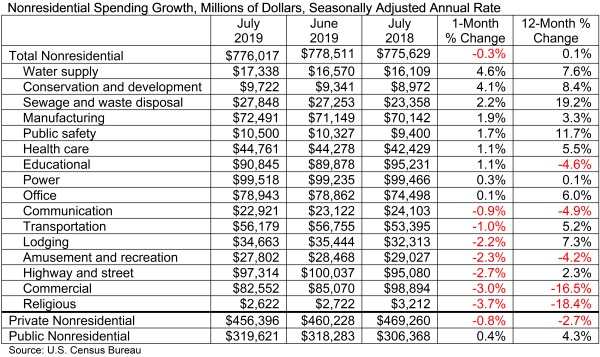
According to an Associated Builders and Contractors analysis of U.S. Census Bureau data published today, national nonresidential construction spending declined 0.3% in July totaling $776 billion on a seasonally adjusted annualized basis, and increased 0.1% compared to July 2018. The June 2019 estimates were revised upward from $773.8 billion to $778.5 billion.
In July, private nonresidential spending decreased 0.8% on a monthly basis and 2.7% on a yearly basis. Public nonresidential spending, however, increased 0.4% for the month and 4.3% for the year.
"While there is much discussion regarding the extent to which the U.S. economy has slowed and will slow going forward, these considerations have relatively little to do with today's nonresidential construction spending data," said ABC Chief Economist Anirban Basu. "Trends in nonresidential construction tend to lag the broader economy by a year to 18 months, which means that today's construction spending numbers reflect in large measure broader economic dynamics characterizing 2018. Last year was a good one for the economy, persuading many to move ahead with projects.
"Recent construction spending data, therefore, have been impacted by factors more closely related to the industry," said Basu. "For instance, the recent weakening in certain private construction segments, including office and lodging, are likely due to growing concerns regarding overbuilding and the somewhat higher cost of capital. Public spending growth, despite solid numbers in July, has been more erratic of late. This may have something to do with the looming insolvency of the Highway Trust Fund, which is expected in 2021 without congressional action. There is already evidence that some states have begun to postpone planning for new projects until there is more clarity regarding federal infrastructure spending, evident in the 2.7% spending decline observed in the highway and street category.
"Despite recent slow growth in construction spending, the U.S. construction industry has continued to expand employment levels during the past year," said Basu. "ABC’s Construction Backlog Indicator continues to show that the average contractor or subcontractor will remain busy over the near term. One of the reasons for relatively slow growth in nonresidential construction spending may simply be that the U.S. contracting community cannot deliver significantly more service in the context of worsening labor/skills shortages. In other words, nonresidential construction volume may already be near its peak potential supply. Given that, one wouldn't expect substantial growth in construction spending even in the context of significantly stronger economic growth."
Related Stories

Market Data | Jul 21, 2021
Architecture Billings Index robust growth continues
AIA’s Architecture Billings Index (ABI) score for June remained at an elevated level of 57.1.

Market Data | Jul 20, 2021
Multifamily proposal activity maintains sizzling pace in Q2
Condos hit record high as all multifamily properties benefit from recovery.

Market Data | Jul 19, 2021
Construction employment trails pre-pandemic level in 39 states
Supply chain challenges, rising materials prices undermine demand.

Market Data | Jul 15, 2021
Producer prices for construction materials and services soar 26% over 12 months
Contractors cope with supply hitches, weak demand.

Market Data | Jul 13, 2021
ABC’s Construction Backlog Indicator and Contractor Confidence Index rise in June
ABC’s Construction Confidence Index readings for sales, profit margins and staffing levels increased modestly in June.

Market Data | Jul 8, 2021
Encouraging construction cost trends are emerging
In its latest quarterly report, Rider Levett Bucknall states that contractors’ most critical choice will be selecting which building sectors to target.

Multifamily Housing | Jul 7, 2021
Make sure to get your multifamily amenities mix right
One of the hardest decisions multifamily developers and their design teams have to make is what mix of amenities they’re going to put into each project. A lot of squiggly factors go into that decision: the type of community, the geographic market, local recreation preferences, climate/weather conditions, physical parameters, and of course the budget. The permutations are mind-boggling.

Market Data | Jul 7, 2021
Construction employment declines by 7,000 in June
Nonresidential firms struggle to find workers and materials to complete projects.

Market Data | Jun 30, 2021
Construction employment in May trails pre-covid levels in 91 metro areas
Firms struggle to cope with materials, labor challenges.

Market Data | Jun 23, 2021
Construction employment declines in 40 states between April and May
Soaring material costs, supply-chain disruptions impede recovery.


