


National nonresidential construction spending decreased 0.4% in January, according to an Associated Builders and Contractors analysis of data published today by the U.S. Census Bureau. On a seasonally adjusted annualized basis, nonresidential spending totaled $1.190 trillion.
Spending was down on a monthly basis in 10 of the 16 nonresidential subcategories. Private nonresidential spending fell 0.1%, while public nonresidential construction spending was down 1.0% in January.
“Nonresidential construction spending fell sharply in January, ending a 19-month streak of monthly gains,” said ABC Chief Economist Anirban Basu. “Some of this decrease is due to weather-related factors. That’s especially true in infrastructure categories like highway and street and water supply, both of which exhibited steep declines in spending to start the year but should remain elevated through 2024.
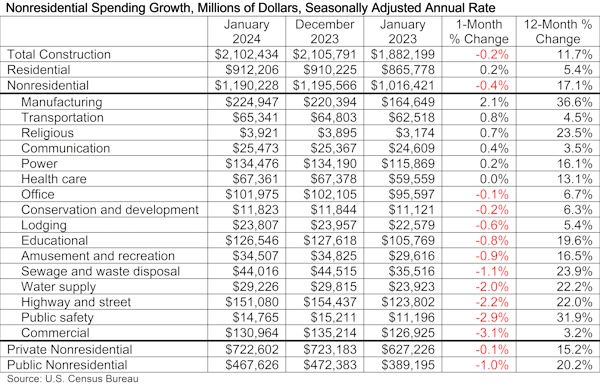
“Construction spending in the manufacturing category, on the other hand, continued to surge in January,” said Basu. “Manufacturing now accounts for nearly $1 of every $5 of nonresidential construction spending.
“Despite January’s disappointing data, nonresidential construction spending is still up more than 17% over the past year,” said Basu. “Given that year-over-year strength and the fact that a majority of contractors expect their sales to increase over the next six months, according to ABC’s Construction Confidence Index, spending is likely to rebound over the coming months.”
Related Stories

Green | Jan 31, 2018
U.S. Green Building Council releases annual top 10 states for LEED green building per capita
Massachusetts tops the list for the second year; New York, Hawaii and Illinois showcase leadership in geographically diverse locations.

Industry Research | Jan 30, 2018
AIA’s Kermit Baker: Five signs of an impending upturn in construction spending
Tax reform implications and rebuilding from natural disasters are among the reasons AIA’s Chief Economist is optimistic for 2018 and 2019.

Market Data | Jan 30, 2018
AIA Consensus Forecast: 4.0% growth for nonresidential construction spending in 2018
The commercial office and retail sectors will lead the way in 2018, with a strong bounce back for education and healthcare.

Market Data | Jan 29, 2018
Year-end data show economy expanded in 2017; Fixed investment surged in fourth quarter
The economy expanded at an annual rate of 2.6% during the fourth quarter of 2017.

Market Data | Jan 25, 2018
Renters are the majority in 42 U.S. cities
Over the past 10 years, the number of renters has increased by 23 million.

Market Data | Jan 24, 2018
HomeUnion names the most and least affordable rental housing markets
Chicago tops the list as the most affordable U.S. metro, while Oakland, Calif., is the most expensive rental market.

Market Data | Jan 12, 2018
Construction input prices inch down in December, Up YOY despite low inflation
Energy prices have been more volatile lately.

Market Data | Jan 4, 2018
Nonresidential construction spending ticks higher in November, down year-over-year
Despite the month-over-month expansion, nonresidential spending fell 1.3 percent from November 2016.

Contractors | Jan 4, 2018
Construction spending in a ‘mature’ period of incremental growth
Labor shortages are spiking wages. Materials costs are rising, too.
 reported the November ABI score was 55.0, up from a score of 51.7 in the previous month. Photo: Pixabay")
Market Data | Dec 20, 2017
Architecture billings upturn shows broad strength
The American Institute of Architects (AIA) reported the November ABI score was 55.0, up from a score of 51.7 in the previous month.


