


National nonresidential construction spending decreased 0.4% in January, according to an Associated Builders and Contractors analysis of data published today by the U.S. Census Bureau. On a seasonally adjusted annualized basis, nonresidential spending totaled $1.190 trillion.
Spending was down on a monthly basis in 10 of the 16 nonresidential subcategories. Private nonresidential spending fell 0.1%, while public nonresidential construction spending was down 1.0% in January.
“Nonresidential construction spending fell sharply in January, ending a 19-month streak of monthly gains,” said ABC Chief Economist Anirban Basu. “Some of this decrease is due to weather-related factors. That’s especially true in infrastructure categories like highway and street and water supply, both of which exhibited steep declines in spending to start the year but should remain elevated through 2024.
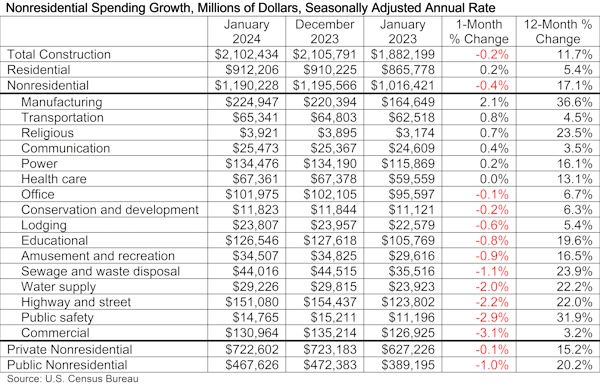
“Construction spending in the manufacturing category, on the other hand, continued to surge in January,” said Basu. “Manufacturing now accounts for nearly $1 of every $5 of nonresidential construction spending.
“Despite January’s disappointing data, nonresidential construction spending is still up more than 17% over the past year,” said Basu. “Given that year-over-year strength and the fact that a majority of contractors expect their sales to increase over the next six months, according to ABC’s Construction Confidence Index, spending is likely to rebound over the coming months.”
Related Stories

Market Data | Jul 29, 2021
Outlook for construction spending improves with the upturn in the economy
The strongest design sector performers for the remainder of this year are expected to be health care facilities.

Market Data | Jul 29, 2021
Construction employment lags or matches pre-pandemic level in 101 metro areas despite housing boom
Eighty metro areas had lower construction employment in June 2021 than February 2020.

Market Data | Jul 28, 2021
Marriott has the largest construction pipeline of U.S. franchise companies in Q2‘21
472 new hotels with 59,034 rooms opened across the United States during the first half of 2021.

Market Data | Jul 27, 2021
New York leads the U.S. hotel construction pipeline at the close of Q2‘21
Many hotel owners, developers, and management groups have used the operational downtime, caused by COVID-19’s impact on operating performance, as an opportunity to upgrade and renovate their hotels and/or redefine their hotels with a brand conversion.

Market Data | Jul 26, 2021
U.S. construction pipeline continues along the road to recovery
During the first and second quarters of 2021, the U.S. opened 472 new hotels with 59,034 rooms.

Market Data | Jul 21, 2021
Architecture Billings Index robust growth continues
AIA’s Architecture Billings Index (ABI) score for June remained at an elevated level of 57.1.

Market Data | Jul 20, 2021
Multifamily proposal activity maintains sizzling pace in Q2
Condos hit record high as all multifamily properties benefit from recovery.

Market Data | Jul 19, 2021
Construction employment trails pre-pandemic level in 39 states
Supply chain challenges, rising materials prices undermine demand.

Market Data | Jul 15, 2021
Producer prices for construction materials and services soar 26% over 12 months
Contractors cope with supply hitches, weak demand.

Market Data | Jul 13, 2021
ABC’s Construction Backlog Indicator and Contractor Confidence Index rise in June
ABC’s Construction Confidence Index readings for sales, profit margins and staffing levels increased modestly in June.


