


National nonresidential construction spending grew 0.9% in November, according to an Associated Builders and Contractors analysis of data published today by the U.S. Census Bureau. On a seasonally adjusted annualized basis, nonresidential spending totaled $930.1 billion for the month.
Spending was up on a monthly basis in nine of the 16 nonresidential subcategories. Private nonresidential spending was up 1.7%, while public nonresidential construction spending was down 0.1% in November.
“The average nonresidential contractor starts 2023 with considerable backlog,” said ABC Chief Economist Anirban Basu. “Not coincidentally, contractors also have significant confidence regarding current year prospects, according to ABC’s Construction Confidence Index, which indicates expectations for growth in sales and employment with margins remaining stable.
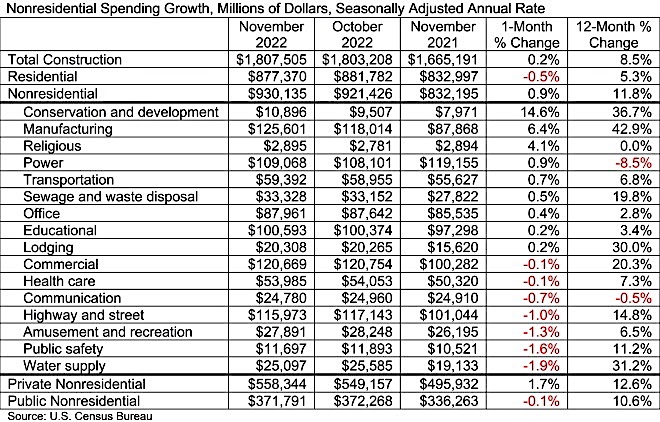
“November’s construction spending report suggests that this confidence is warranted,” said Basu. “However, there are countervailing considerations. First, growth in nonresidential construction spending in November was not especially broad. Much of the growth came from the manufacturing category, which is partially attributable to construction related to large-scale chip manufacturing facilities. The balance of growth came mostly from conservation and development, which includes flood control expenditures. Were it not for those two categories, nonresidential construction spending would have been roughly flat in November.
“Second, backlog could dry up,” said Basu. “Anecdotal evidence suggests that banks are more cautious in their lending to the commercial real estate and multifamily segments. Fears of recession this year remain pervasive in an environment characterized by high and rising interest rates. It will be interesting to see how well backlog will hold up as contractors continue to build and the economy heads toward what is likely to be a Federal Reserve-induced recession.”
Related Stories

Market Data | Jul 29, 2021
Outlook for construction spending improves with the upturn in the economy
The strongest design sector performers for the remainder of this year are expected to be health care facilities.

Market Data | Jul 29, 2021
Construction employment lags or matches pre-pandemic level in 101 metro areas despite housing boom
Eighty metro areas had lower construction employment in June 2021 than February 2020.

Market Data | Jul 28, 2021
Marriott has the largest construction pipeline of U.S. franchise companies in Q2‘21
472 new hotels with 59,034 rooms opened across the United States during the first half of 2021.

Market Data | Jul 27, 2021
New York leads the U.S. hotel construction pipeline at the close of Q2‘21
Many hotel owners, developers, and management groups have used the operational downtime, caused by COVID-19’s impact on operating performance, as an opportunity to upgrade and renovate their hotels and/or redefine their hotels with a brand conversion.

Market Data | Jul 26, 2021
U.S. construction pipeline continues along the road to recovery
During the first and second quarters of 2021, the U.S. opened 472 new hotels with 59,034 rooms.

Market Data | Jul 21, 2021
Architecture Billings Index robust growth continues
AIA’s Architecture Billings Index (ABI) score for June remained at an elevated level of 57.1.

Market Data | Jul 20, 2021
Multifamily proposal activity maintains sizzling pace in Q2
Condos hit record high as all multifamily properties benefit from recovery.

Market Data | Jul 19, 2021
Construction employment trails pre-pandemic level in 39 states
Supply chain challenges, rising materials prices undermine demand.

Market Data | Jul 15, 2021
Producer prices for construction materials and services soar 26% over 12 months
Contractors cope with supply hitches, weak demand.

Market Data | Jul 13, 2021
ABC’s Construction Backlog Indicator and Contractor Confidence Index rise in June
ABC’s Construction Confidence Index readings for sales, profit margins and staffing levels increased modestly in June.


