


National nonresidential construction spending rose 0.5% in September but is down 0.9% on a year-ago basis, according to an Associated Builders and Contractors analysis of data published today by the U.S. Census Bureau. On a seasonally adjusted annualized basis, spending totaled $775.6 billion, 2.4% lower than the cyclical peak in April 2019.
Private nonresidential spending fell 0.3% on a monthly basis and is down 5.7% compared to the same time last year, while public nonresidential construction spending expanded 1.5% for the month and is up 6.6% for the year. This comports neatly with today’s employment report and GDP data released earlier this week, which revealed ongoing growth in outlays for infrastructure but declining investment in structures.
“Construction spending contracted in a number of private segments, including in the commercial and lodging categories,” said ABC Chief Economist Anirban Basu. "While it would be easy to attribute this to a slowing economy and/or growing concerns regarding the saturation of available space in certain private segments, there are also large-scale economic transformations playing a role. Commercial construction spending is down nearly 19%, as traditional retailers continue to contend with the growing presence and capabilities of e-commerce giants, while those in the lodging segment—which dipped in September and is essentially flat year-over-year—are increasingly competing with online platforms such as Airbnb.
“Meanwhile, public construction remains one of the strongest elements of the U.S. economy,” said Basu. “Spending in the water supply category surged nearly 6% in September and is up 20% on a year-over-year basis. Overall, public nonresidential construction is up nearly 7% over the past 12 months as state and local government finances enjoy their best health in more than a decade. While there were some declines on a monthly basis in certain public segments in September, year-over-year spending is up more than 6% in the highway/street category, by nearly 6% in the transportation segment and by nearly 9% in the public safety category.
“Leading indicators, including the Architecture Billings Index, continue to point toward sluggish growth or worse in private construction,” said Basu. “Public construction spending, by contrast, should remain a source of economic expansion during the months ahead, but the looming insolvency of the Highway Trust Fund must be addressed soon for momentum to persist. In September, nine of 16 nonresidential construction segments experienced a decline in spending, and there has been a negative trend in place since April. Accordingly, viewed from a high-level perspective, the outlook for nonresidential construction spending is becoming increasingly uncertain, though available data regarding backlog suggest that the industry will enter 2020 with residual momentum.”


Related Stories
Market Data | May 12, 2020
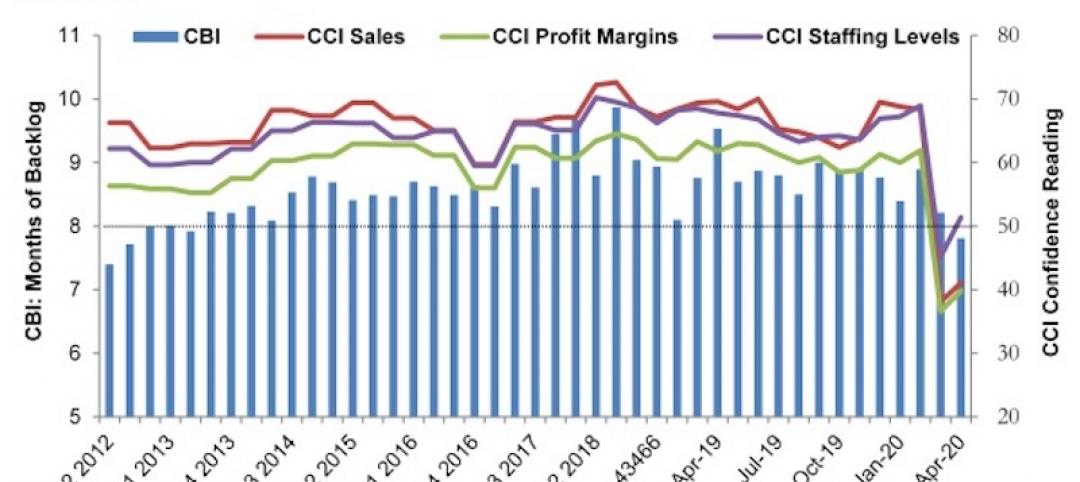
ABC’s Construction Backlog Indicator falls in April; Contractor Confidence rebounds from historic lows
Nonresidential construction backlog is down 0.4 months compared to the March 2020 ABC survey and 1.7 months from April 2019.

Market Data | May 12, 2020
6 must reads for the AEC industry today: May 12, 2020
A 13-point plan to reduce coronavirus deaths in nursing homes and Bjarke Ingels discusses building on Mars.

Market Data | May 11, 2020
Interest in eSports is booming amid COVID-19
The industry has proved largely immune to the COVID-19 pandemic due to its prompt transition into online formats and sudden spike in interest from traditional sports organizations.

Market Data | May 11, 2020
6 must reads for the AEC industry today: May 11, 2020
Nashville residential tower will rise 416 feet and the construction industry loses 975,000 jobs.

Market Data | May 8, 2020
Construction industry loses 975,000 jobs in April as new association survey shows deteriorating demand for construction projects
Association partner Procore also releases near real-time construction data measuring impacts of coronavirus as association calls for new measures.

Market Data | May 8, 2020
7 must reads for the AEC industry today: May 8, 2020
The death of the office and Colorado's first multifamily project to receive WELL Precertification.

Market Data | May 7, 2020
5 must reads for the AEC industry today: May 7, 2020
5 memory care communities with a strong sense of mission and making jobsites safer in the COVID-19 world.

Market Data | May 6, 2020
6 must reads for the AEC industry today: May 6, 2020
5 questions engineers will ask after COVID-19 and coronavirus threatens push for denser housing.

Market Data | May 5, 2020
5 must reads for the AEC industry today: May 5, 2020
A new temporary hospital pops up in N.J., and apartment firms' reactivation plans begin to take shape.

Market Data | May 4, 2020
6 must reads for the AEC industry today: May 4, 2020
How working from home is influencing design and is this the end of the open office?


