


Nonresidential construction spending bounced back in October, expanding 1 percent on a monthly basis and 4.3 percent year over year, according to a Dec. 2 release from the U.S. Census Bureau. Spending for the month totaled $611.8 billion on a seasonally adjusted, annualized basis. Additionally, the government revised the September spending figure up to $605.8 billion from $596.1 billion.
"This month's increase in nonresidential construction spending is far more consistent with the anecdotal information floating around the industry, which generally indicates that firms are becoming busier and that backlog is expanding," said Associated Builders and Contractors (ABC) Chief Economist Anirban Basu. "Although last month's numbers for nonresidential construction spending and employment were disappointing and could have implied the nation's nonresidential construction recovery is stalling, that is not the case.
"The outlook for 2015 remains upbeat," said Basu. "The economy has gained momentum over the past six to seven months and that is consistent with more aggressive construction starts and spending during the year to come. Even as the economy has gained momentum, the Federal Reserve has remained extraordinarily accommodative due in part to benign inflation readings. Low interest rates combined with solid economic momentum likely mean expansion for the nonresidential construction industry during the year ahead."
Eleven of the 16 nonresidential construction subsectors posted monthly increases in spending. Here's a recap:
• Office-related construction spending grew by 2 percent in October and is up 16.3 percent from the same time one year ago.
• Lodging construction spending is up 3.3 percent on a monthly basis and is up 15.9 percent on a year-over-year basis.
• Conservation and development-related construction spending grew 4.6 percent for the month and is up 33.1 percent on a yearly basis.
• Spending in the water supply category expanded 0.9 percent on a monthly basis, but is down 1.8 percent on a year-over-year basis.
• Amusement and recreation-related construction spending expanded 2.2 percent in October and is up 1.4 percent from the same time last year.
• Manufacturing-related spending expanded 3.4 percent on a monthly basis and is up 22.2 percent on an annual basis.
• Healthcare-related construction spending expanded 0.6 percent for the month but is down 8.4 percent from the same time last year.
• Education-related construction spending expanded 1.8 percent for the month and is up 3.6 percent on a year-over-year basis.
• Construction spending in the transportation category expanded 2.7 percent on a monthly basis and has expanded 1.6 percent on an annual basis.
• Highway and street-related construction spending expanded 1.2 percent in October and is up 0.1 percent compared to the same time last year.
• Public safety-related construction spending expanded 11.6 percent on a monthly basis but is down 1.2 percent on a year-over-year basis.
Monthly spending in five nonresidential construction subsectors declined in October. They are:
• Commercial construction spending fell 2.2 percent for the month but has grown 9.1 percent on a year-over-year basis.
• Communication construction spending declined 1.9 percent for the month and is down 9.4 percent for the year.
• Religious construction spending fell 3.7 percent for the month and is down 4.6 percent from the same time last year.
• Sewage and waste disposal-related construction spending declined 0.4 percent for the month and is down 0.2 percent on a 12-month basis.
• Power construction spending fell 1 percent for the month but is 0.7 percent higher than at the same time one year ago.
To view the previous spending report, click here.
Related Stories

| Aug 8, 2013
Level of Development: Will a new standard bring clarity to BIM model detail?
The newly released LOD Specification document allows Building Teams to understand exactly what’s in the BIM model they’re being handed.
| Aug 8, 2013
Vertegy spins off to form independent green consultancy
St. Louis-based Vertegy has announced the formation of Vertegy, LLC, transitioning into an independent company separate from the Alberici Enterprise. The new company was officially unveiled Aug. 1, 2013

| Aug 5, 2013
Top Retail Architecture Firms [2013 Giants 300 Report]
Callison, Stantec, Gensler top Building Design+Construction's 2013 ranking of the largest retail architecture and architecture/engineering firms in the United States.
")
| Aug 5, 2013
Top Retail Engineering Firms [2013 Giants 300 Report]
Jacobs, AECOM, Henderson Engineers top Building Design+Construction's 2013 ranking of the largest retail engineering and engineering/architecture firms in the United States.
 through renovation of an existing store, Yummy Market brings European-style shopping to suburban Toronto. The new 50,000-sf market includes a kitchen for prepared foods, bakery/patisserie, deli, butcher shop, fishmonger, juice bar, caf, flower shop, self-serve bulk foods, and an extensive array of imported specialties. Photo: Anthony Gomez/A.G. Photography")
| Aug 5, 2013
Retail market shows signs of life [2013 Giants 300 Report]
Retail rentals and occupancy are finally on the rise after a long stretch in the doldrums.

| Aug 5, 2013
Top Retail Construction Firms [2013 Giants 300 Report]
Shawmut, Whiting-Turner, PCL top Building Design+Construction's 2013 ranking of the largest retail contractor and construction management firms in the United States.
| Aug 2, 2013
Michael Baker Corp. agrees to be acquired by Integrated Mission Solutions
Michael Baker Corporation (“Baker”) (NYSE MKT:BKR) announced today that it has entered into a definitive merger agreement to be acquired by Integrated Mission Solutions, LLC (“IMS”), an affiliate of DC Capital Partners, LLC (“DC Capital”).

| Jul 31, 2013
Hotel, retail sectors bright spots of sluggish nonresidential construction market
A disappointing recovery of the U.S. economy is limiting need for new nonresidential building activity, said AIA Chief Economist, Kermit Baker in the AIA's semi-annual Consensus Construction Forecast, released today. As a result, AIA reduced its projections for 2013 spending to 2.3%.
| Jul 30, 2013
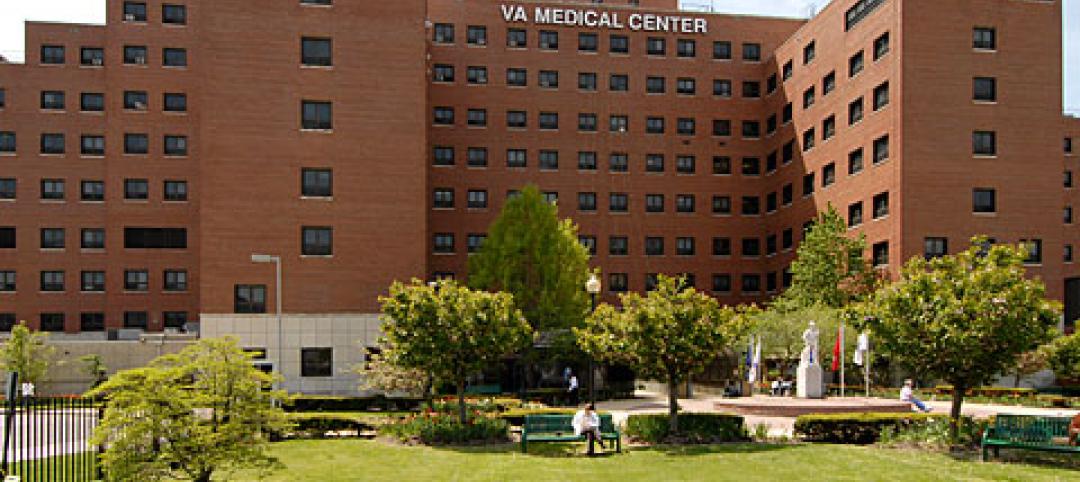
Better planning and delivery sought for VA healthcare facilities
Making Veterans Administration healthcare projects “better planned, better delivered” is the new goal of the VA’s Office of Construction and Facilities Management.

| Jul 30, 2013
Healthcare designers get an earful about controlling medical costs
At the current pace, in 2020 the U.S. will spend $4.2 trillion a year on healthcare; unchecked, waste would hit $1.2 trillion. Yet “waste” is keeping a lot of poorly performing hospitals in business, said healthcare facility experts at the recent American College of Healthcare Architects/AIA Academy of Architecture for Health Summer Leadership Summit in Chicago.


