


Nonresidential construction spending bounced back in October, expanding 1 percent on a monthly basis and 4.3 percent year over year, according to a Dec. 2 release from the U.S. Census Bureau. Spending for the month totaled $611.8 billion on a seasonally adjusted, annualized basis. Additionally, the government revised the September spending figure up to $605.8 billion from $596.1 billion.
"This month's increase in nonresidential construction spending is far more consistent with the anecdotal information floating around the industry, which generally indicates that firms are becoming busier and that backlog is expanding," said Associated Builders and Contractors (ABC) Chief Economist Anirban Basu. "Although last month's numbers for nonresidential construction spending and employment were disappointing and could have implied the nation's nonresidential construction recovery is stalling, that is not the case.
"The outlook for 2015 remains upbeat," said Basu. "The economy has gained momentum over the past six to seven months and that is consistent with more aggressive construction starts and spending during the year to come. Even as the economy has gained momentum, the Federal Reserve has remained extraordinarily accommodative due in part to benign inflation readings. Low interest rates combined with solid economic momentum likely mean expansion for the nonresidential construction industry during the year ahead."
Eleven of the 16 nonresidential construction subsectors posted monthly increases in spending. Here's a recap:
• Office-related construction spending grew by 2 percent in October and is up 16.3 percent from the same time one year ago.
• Lodging construction spending is up 3.3 percent on a monthly basis and is up 15.9 percent on a year-over-year basis.
• Conservation and development-related construction spending grew 4.6 percent for the month and is up 33.1 percent on a yearly basis.
• Spending in the water supply category expanded 0.9 percent on a monthly basis, but is down 1.8 percent on a year-over-year basis.
• Amusement and recreation-related construction spending expanded 2.2 percent in October and is up 1.4 percent from the same time last year.
• Manufacturing-related spending expanded 3.4 percent on a monthly basis and is up 22.2 percent on an annual basis.
• Healthcare-related construction spending expanded 0.6 percent for the month but is down 8.4 percent from the same time last year.
• Education-related construction spending expanded 1.8 percent for the month and is up 3.6 percent on a year-over-year basis.
• Construction spending in the transportation category expanded 2.7 percent on a monthly basis and has expanded 1.6 percent on an annual basis.
• Highway and street-related construction spending expanded 1.2 percent in October and is up 0.1 percent compared to the same time last year.
• Public safety-related construction spending expanded 11.6 percent on a monthly basis but is down 1.2 percent on a year-over-year basis.
Monthly spending in five nonresidential construction subsectors declined in October. They are:
• Commercial construction spending fell 2.2 percent for the month but has grown 9.1 percent on a year-over-year basis.
• Communication construction spending declined 1.9 percent for the month and is down 9.4 percent for the year.
• Religious construction spending fell 3.7 percent for the month and is down 4.6 percent from the same time last year.
• Sewage and waste disposal-related construction spending declined 0.4 percent for the month and is down 0.2 percent on a 12-month basis.
• Power construction spending fell 1 percent for the month but is 0.7 percent higher than at the same time one year ago.
To view the previous spending report, click here.
Related Stories

Codes and Standards | Sep 21, 2016
Healthy buildings becoming a key design priority for both architects and building owners
Nationwide survey finds nearly three of four architects cite health impacts influencing design decisions

Cultural Facilities | Sep 19, 2016
International competition recognizes insect-inspired design for Moscow Circus School
The proposal would make the school’s activities more transparent to the public.
Architects | Sep 19, 2016
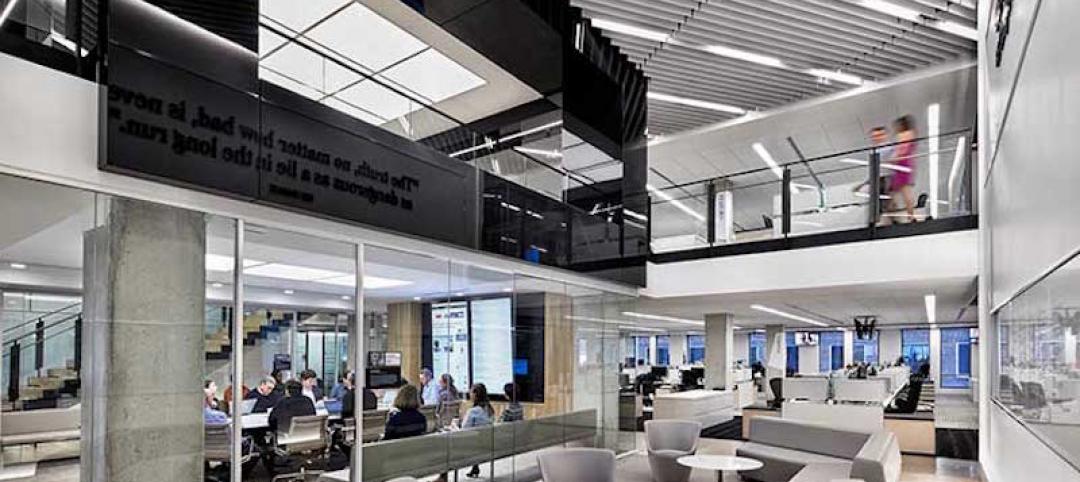
A workplace designed for the innovation economy
Over the past 100 years, how we work has changed dramatically, and these changes have impacted workplace design.

Architects | Sep 16, 2016
Former architect now builds architectural wonders out of LEGO blocks
Adam Reed Tucker’s creations are currently on display at the Museum of Science and Industry.

Architects | Sep 15, 2016
Implicit bias: How the unconscious mind drives business decisions
Companies are tapping into the latest research in psychology and sociology to advance their diversity and inclusion efforts when it comes to hiring, promoting, compensation, and high-performance teaming, writes BD+C's David Barista.

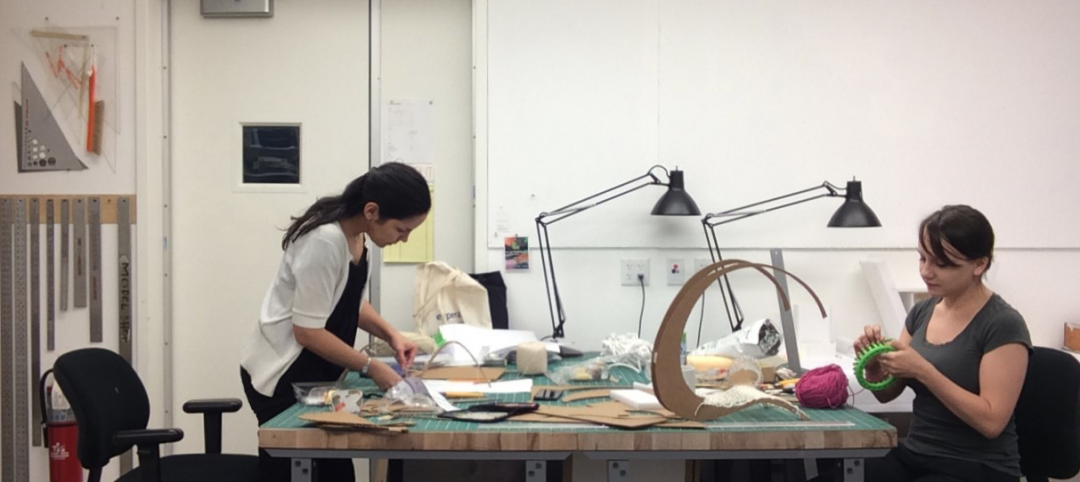
Museums | Sep 14, 2016
Architectural model museum opens in Japan
The museum includes models from Japanese architects including Shingeru Ban, Kengo Kuma, and Riken Yamamoto.
Designers | Sep 13, 2016
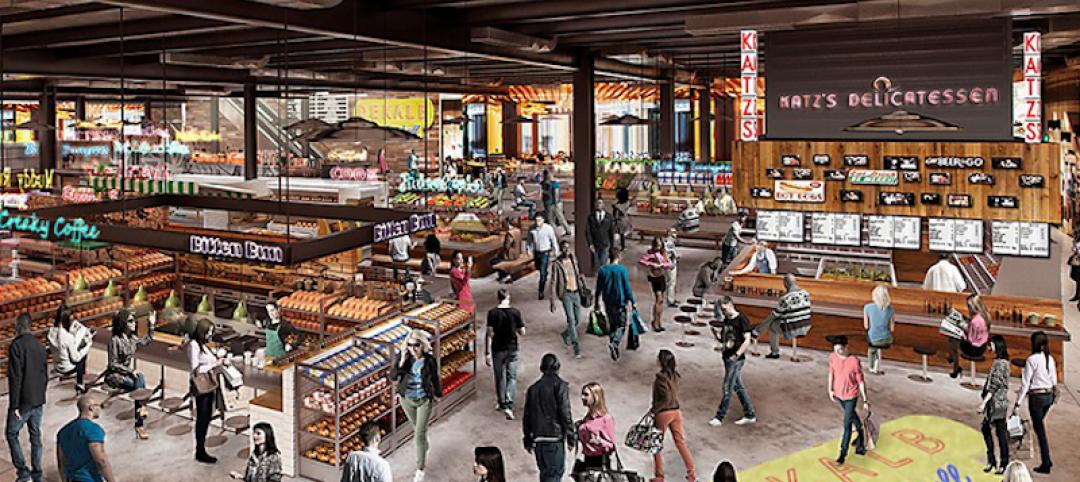
5 trends propelling a new era of food halls
Food halls have not only become an economical solution for restauranteurs and chefs experiencing skyrocketing retail prices and rents in large cities, but they also tap into our increased interest in gourmet locally sourced food, writes Gensler's Toshi Kasai.
AEC Tech | Sep 6, 2016
Innovation intervention: How AEC firms are driving growth through R&D programs
AEC firms are taking a page from the tech industry, by infusing a deep commitment to innovation and disruption into their cultural DNA.

Office Buildings | Sep 2, 2016
Eight-story digital installation added as part of ESI Design’s renovation of Denver’s Wells Fargo Center
The crown jewel of a three-year makeover project, the LED columns bring the building’s lobby to life.
| Sep 1, 2016
TRANSIT GIANTS: A ranking of the nation's top transit sector design and construction firms
Skidmore, Owings & Merrill, Perkins+Will, Skanska USA, Webcor Builders, Jacobs, and STV top Building Design+Construction’s annual ranking of the nation’s largest transit sector AEC firms, as reported in the 2016 Giants 300 Report.


