Nonresidential construction spending bounced back in October, expanding 1 percent on a monthly basis and 4.3 percent year over year, according to a Dec. 2 release from the U.S. Census Bureau. Spending for the month totaled $611.8 billion on a seasonally adjusted, annualized basis. Additionally, the government revised the September spending figure up to $605.8 billion from $596.1 billion.
"This month's increase in nonresidential construction spending is far more consistent with the anecdotal information floating around the industry, which generally indicates that firms are becoming busier and that backlog is expanding," said Associated Builders and Contractors (ABC) Chief Economist Anirban Basu. "Although last month's numbers for nonresidential construction spending and employment were disappointing and could have implied the nation's nonresidential construction recovery is stalling, that is not the case.
"The outlook for 2015 remains upbeat," said Basu. "The economy has gained momentum over the past six to seven months and that is consistent with more aggressive construction starts and spending during the year to come. Even as the economy has gained momentum, the Federal Reserve has remained extraordinarily accommodative due in part to benign inflation readings. Low interest rates combined with solid economic momentum likely mean expansion for the nonresidential construction industry during the year ahead."
Eleven of the 16 nonresidential construction subsectors posted monthly increases in spending. Here's a recap:
• Office-related construction spending grew by 2 percent in October and is up 16.3 percent from the same time one year ago.
• Lodging construction spending is up 3.3 percent on a monthly basis and is up 15.9 percent on a year-over-year basis.
• Conservation and development-related construction spending grew 4.6 percent for the month and is up 33.1 percent on a yearly basis.
• Spending in the water supply category expanded 0.9 percent on a monthly basis, but is down 1.8 percent on a year-over-year basis.
• Amusement and recreation-related construction spending expanded 2.2 percent in October and is up 1.4 percent from the same time last year.
• Manufacturing-related spending expanded 3.4 percent on a monthly basis and is up 22.2 percent on an annual basis.
• Healthcare-related construction spending expanded 0.6 percent for the month but is down 8.4 percent from the same time last year.
• Education-related construction spending expanded 1.8 percent for the month and is up 3.6 percent on a year-over-year basis.
• Construction spending in the transportation category expanded 2.7 percent on a monthly basis and has expanded 1.6 percent on an annual basis.
• Highway and street-related construction spending expanded 1.2 percent in October and is up 0.1 percent compared to the same time last year.
• Public safety-related construction spending expanded 11.6 percent on a monthly basis but is down 1.2 percent on a year-over-year basis.
Monthly spending in five nonresidential construction subsectors declined in October. They are:
• Commercial construction spending fell 2.2 percent for the month but has grown 9.1 percent on a year-over-year basis.
• Communication construction spending declined 1.9 percent for the month and is down 9.4 percent for the year.
• Religious construction spending fell 3.7 percent for the month and is down 4.6 percent from the same time last year.
• Sewage and waste disposal-related construction spending declined 0.4 percent for the month and is down 0.2 percent on a 12-month basis.
• Power construction spending fell 1 percent for the month but is 0.7 percent higher than at the same time one year ago.
To view the previous spending report, click here.
Related Stories
Codes and Standards | Sep 9, 2019
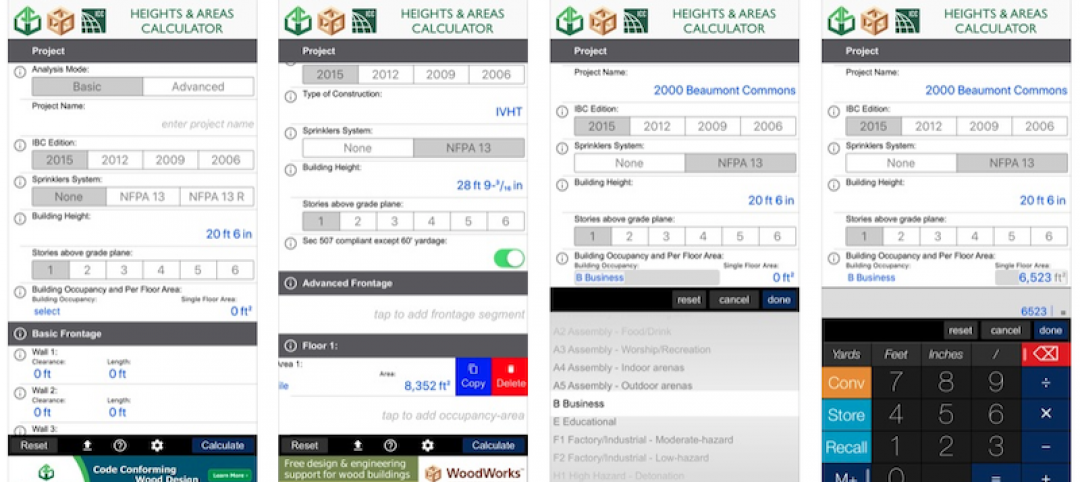
Free app calculates maximum allowable heights and areas for buildings
A free app that calculates the maximum allowable heights and areas for buildings of various occupancy classifications and types of construction has been released.
Retail Centers | Sep 6, 2019
Another well-known retailer files for bankruptcy: Here's the solution to more empty anchor stores
Where can you find the future of retail? At the intersection of experience and instant gratification.
Giants 400 | Sep 5, 2019
Top 110 Hotel Sector Architecture Firms for 2019
Gensler, WATG, HKS, HBG Design, and Steelman Partners top the rankings of the nation's largest hotel sector architecture and architecture engineering (AE) firms, as reported in Building Design+Construction's 2019 Giants 300 Report.
Architects | Sep 5, 2019
AIA launches landmark initiative to drive climate action
AIA Board of Directors approves member-led resolution to rally architects in mitigating and adapting the built environment.
Giants 400 | Sep 3, 2019
Top 140 K-12 School Sector Architecture Firms for 2019
DLR Group, PBK, Huckabee, Stantec, and VLK Architects top the rankings of the nation's largest K-12 school sector architecture and architecture engineering (AE) firms, as reported in Building Design+Construction's 2019 Giants 300 Report.
Market Data | Sep 3, 2019
Nonresidential construction spending slips in July 2019, but still surpasses $776 billion
Construction spending declined 0.3% in July, totaling $776 billion on a seasonally adjusted annualized basis.
Giants 400 | Aug 30, 2019
2019 K-12 School Giants Report: 360-degree learning among top school design trends for 2019
K-12 school districts are emphasizing practical, hands-on experience and personalized learning.
Giants 400 | Aug 28, 2019
Top 35 Data Center Architecture Firms for 2019
Corgan, HDR, Gensler, AECOM, and Page top the rankings of the nation's largest data center sector architecture and architecture engineering (AE) firms, as reported in Building Design+Construction's 2019 Giants 300 Report.
AEC Innovators | Aug 27, 2019
7 AEC industry disruptors and their groundbreaking achievements
From building prefab factories in the sky to incubating the next generation of AEC tech startups, our 2019 class of AEC Innovators demonstrates that the industry is poised for a shakeup. Meet BD+C’s 2019 AEC Innovators.
Giants 400 | Aug 16, 2019
2019 Healthcare Giants Report: The ‘smart hospital’ is on the horizon
These buildings perform functions like a medical practitioner. This and more healthcare sector trends from Building Design+Construction's 2019 Giants 300 Report.


