


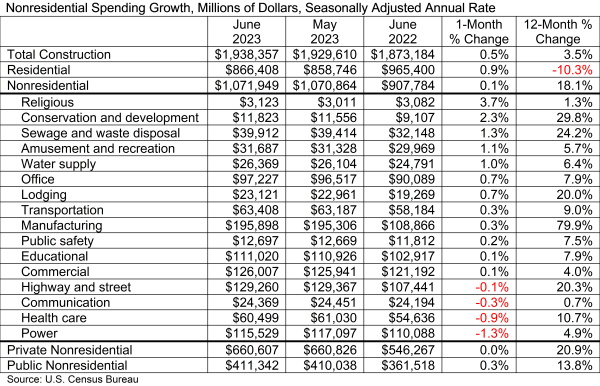
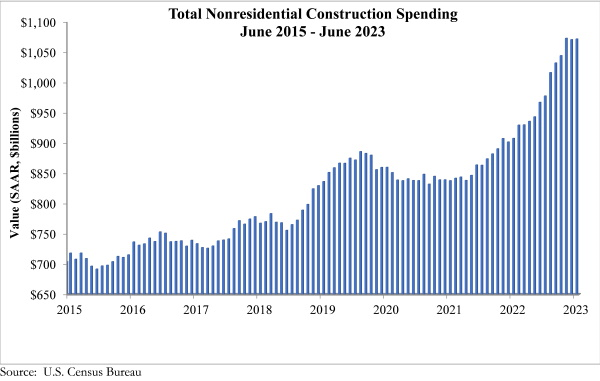
National nonresidential construction spending increased 0.1% in June, according to an Associated Builders and Contractors analysis of data published today by the U.S. Census Bureau. Spending is up 18% over the past 12 months. On a seasonally adjusted annualized basis, nonresidential spending totaled $1.07 trillion in June.
Spending increased on a monthly basis in 12 of the 16 nonresidential subcategories. Private nonresidential spending was virtually unchanged, while public nonresidential construction spending rose 0.3% in June.
“Nonresidential construction spending growth downshifted over the past two months,” said ABC Chief Economist Anirban Basu. “While stakeholders can expect ongoing spending growth in public nonresidential construction segments as more Infrastructure Investment and Jobs Act monies flow into the economy, private developer-driven activity appears to be drying up in the context of higher costs of capital and tighter credit conditions.
“Among other things, these dynamics will translate into larger spreads in performance among contractors,” said Basu. “While those that focus on public work stand to remain busy for years to come, those who specialize in meeting the needs of developers of office buildings, hotels and shopping centers are likely to struggle to support backlog going forward. The good news is that there remain private construction segments associated with rosier prospects, including manufacturing, data centers and healthcare.”
Related Stories

Market Data | Aug 13, 2018
First Half 2018 commercial and multifamily construction starts show mixed performance across top metropolitan areas
Gains reported in five of the top ten markets.

Market Data | Aug 10, 2018
Construction material prices inch down in July
Nonresidential construction input prices increased fell 0.3% in July but are up 9.6% year over year.

Market Data | Aug 9, 2018
Projections reveal nonresidential construction spending to grow
AIA releases latest Consensus Construction Forecast.
Market Data | Aug 7, 2018
New supply's impact illustrated in Yardi Matrix national self storage report for July
The metro with the most units under construction and planned as a percent of existing inventory in mid-July was Nashville, Tenn.

Market Data | Aug 3, 2018
U.S. multifamily rents reach new heights in July
Favorable economic conditions produce a sunny summer for the apartment sector.

Market Data | Aug 2, 2018
Nonresidential construction spending dips in June
“The hope is that June’s construction spending setback is merely a statistical aberration,” said ABC Chief Economist Anirban Basu.

Market Data | Aug 1, 2018
U.S. hotel construction pipeline continues moderate growth year-over-year
The hotel construction pipeline has been growing moderately and incrementally each quarter.

Market Data | Jul 30, 2018
Nonresidential fixed investment surges in second quarter
Nonresidential fixed investment represented an especially important element of second quarter strength in the advance estimate.

Market Data | Jul 11, 2018
Construction material prices increase steadily in June
June represents the latest month associated with rapidly rising construction input prices.

Market Data | Jun 26, 2018
Yardi Matrix examines potential regional multifamily supply overload
Outsize development activity in some major metros could increase vacancy rates and stagnate rent growth.


