


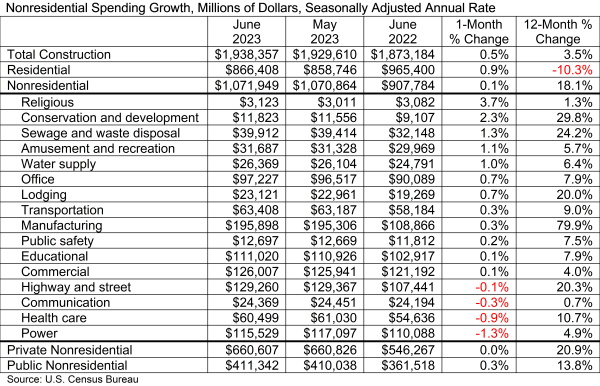
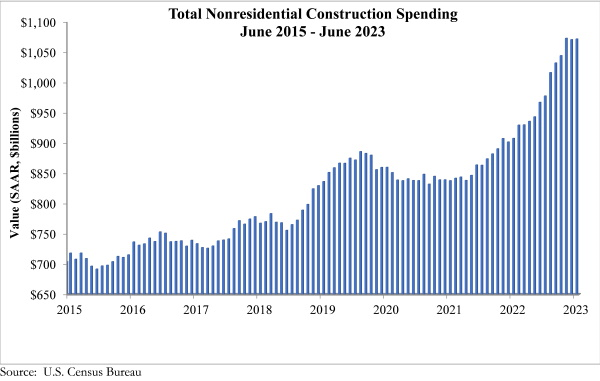
National nonresidential construction spending increased 0.1% in June, according to an Associated Builders and Contractors analysis of data published today by the U.S. Census Bureau. Spending is up 18% over the past 12 months. On a seasonally adjusted annualized basis, nonresidential spending totaled $1.07 trillion in June.
Spending increased on a monthly basis in 12 of the 16 nonresidential subcategories. Private nonresidential spending was virtually unchanged, while public nonresidential construction spending rose 0.3% in June.
“Nonresidential construction spending growth downshifted over the past two months,” said ABC Chief Economist Anirban Basu. “While stakeholders can expect ongoing spending growth in public nonresidential construction segments as more Infrastructure Investment and Jobs Act monies flow into the economy, private developer-driven activity appears to be drying up in the context of higher costs of capital and tighter credit conditions.
“Among other things, these dynamics will translate into larger spreads in performance among contractors,” said Basu. “While those that focus on public work stand to remain busy for years to come, those who specialize in meeting the needs of developers of office buildings, hotels and shopping centers are likely to struggle to support backlog going forward. The good news is that there remain private construction segments associated with rosier prospects, including manufacturing, data centers and healthcare.”
Related Stories

Market Data | Apr 16, 2019
ABC’s Construction Backlog Indicator rebounds in February
ABC's Construction Backlog Indicator expanded to 8.8 months in February 2019.

Market Data | Apr 8, 2019
Engineering, construction spending to rise 3% in 2019: FMI outlook
Top-performing segments forecast in 2019 include transportation, public safety, and education.

Market Data | Apr 1, 2019
Nonresidential spending expands again in February
Private nonresidential spending fell 0.5% for the month and is only up 0.1% on a year-over-year basis.

Market Data | Mar 22, 2019
Construction contractors regain confidence in January 2019
Expectations for sales during the coming six-month period remained especially upbeat in January.

Market Data | Mar 21, 2019
Billings moderate in February following robust New Year
AIA’s Architecture Billings Index (ABI) score for February was 50.3, down from 55.3 in January.

Market Data | Mar 19, 2019
ABC’s Construction Backlog Indicator declines sharply in January 2019
The Construction Backlog Indicator contracted to 8.1 months during January 2019.

Market Data | Mar 15, 2019
2019 starts off with expansion in nonresidential spending
At a seasonally adjusted annualized rate, nonresidential spending totaled $762.5 billion for the month.

Market Data | Mar 14, 2019
Construction input prices rise for first time since October
Of the 11 construction subcategories, seven experienced price declines for the month.

Market Data | Mar 6, 2019
Global hotel construction pipeline hits record high at 2018 year-end
There are a record-high 6,352 hotel projects and 1.17 million rooms currently under construction worldwide.

Market Data | Feb 28, 2019
U.S. economic growth softens in final quarter of 2018
Year-over-year GDP growth was 3.1%, while average growth for 2018 was 2.9%.


