

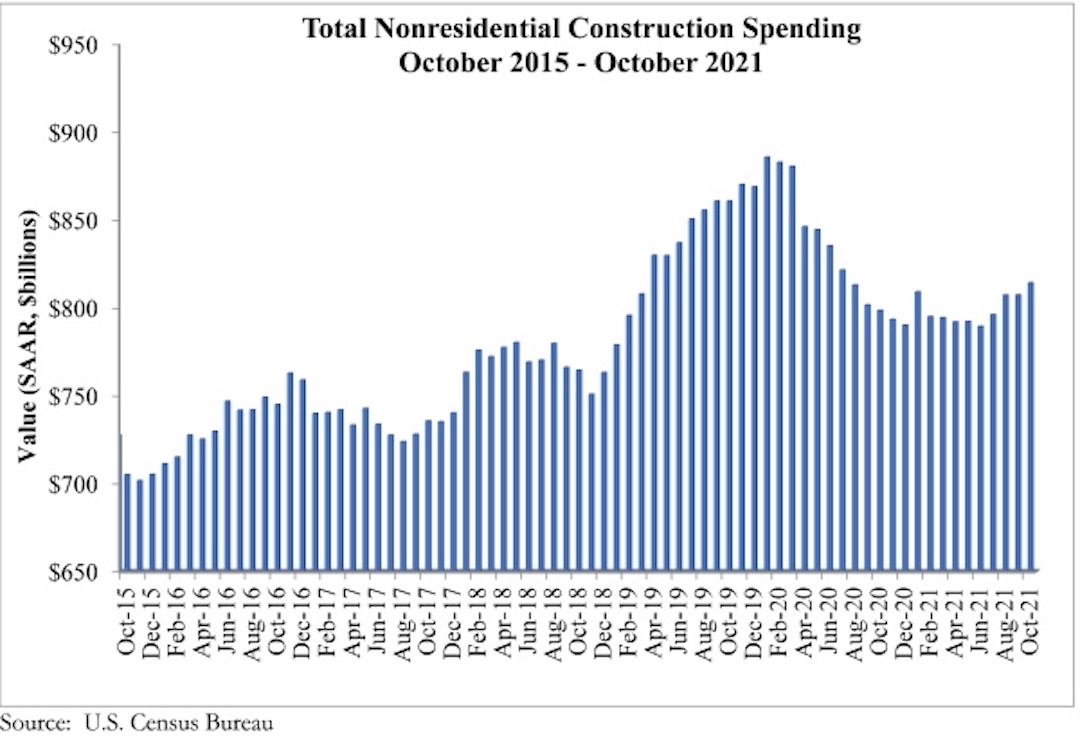
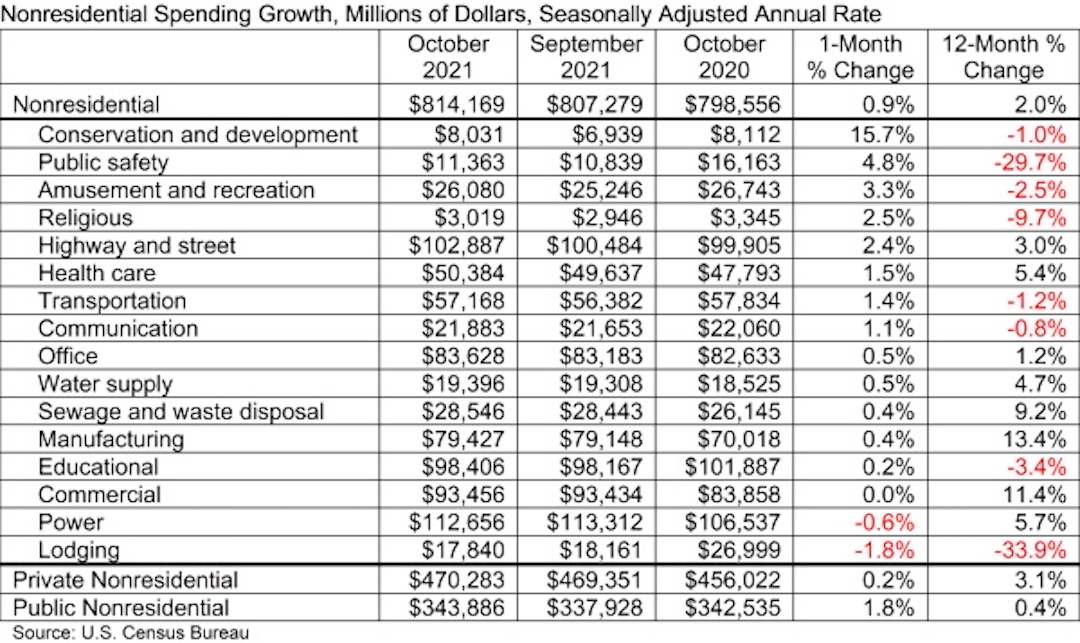
National nonresidential construction spending was up 0.9% in October, according to an Associated Builders and Contractors analysis of data published today by the U.S. Census Bureau. On a seasonally adjusted annualized basis, nonresidential spending totaled $814.2 billion for the month.
Spending was up on a monthly basis in 13 of the 16 nonresidential subcategories, with spending in the commercial subcategory virtually unchanged for the month. Private nonresidential spending was up slightly by 0.2%, while public nonresidential construction spending increased 1.8% in October.
“On the surface, there is much to be encouraged by in October’s construction spending data,” said ABC Chief Economist Anirban Basu. “Nonresidential spending is now at its highest level since July 2020 and has rebounded 3.1% since bottoming out in June 2021. Nonresidential spending expanded meaningfully for the month and those gains were spread across most subsectors. Data characterizing the two prior months were upwardly revised by a combined $27 billion, or 1.7%.
“But construction data do not adjust for inflation, and these spending gains are largely attributable to increases in the cost of delivering construction services,” said Basu. “Challenges that have suppressed nonresidential construction spending growth remain firmly in place. While lofty levels of investment in real estate would normally be associated with significant private construction volumes, many project owners have been induced to postpone projects because of elevated material and labor costs as well as widespread shortages.
“Still, leading indicators remain positive,” said Basu. “ABC members collectively expect revenues and employment levels to climb during the months ahead, according to ABC’s Construction Confidence Index. Design work is plentiful, which means that many investors are at least considering moving forward with projects. In certain geographies, especially in the southern United States, office and other segments are improving, which should translate into more abundant construction starts once global supply chains and materials prices normalize. In this regard, the emergence of the omicron variant adds another layer of uncertainty and may prevent certain materials and equipment prices from declining in the very near term.
“The bottom line is that 2022 should be an excellent year for nonresidential construction,” said Basu. “Performance will be led by public construction, especially in the context of a recently passed and large infrastructure package. Among the segments that are set to zoom ahead are roads and bridges, school construction, water systems, airports, seaports and rail. Traditional office and lodging construction will likely remain weak in much of the nation, however.”

Related Stories

Building Technology | Apr 11, 2016
A nascent commercial wireless sensor market is poised to ascend in the next decade
Europe and Asia will propel that growth, according to a new report from Navigant.

Industry Research | Apr 7, 2016
CBRE provides latest insight into healthcare real estate investors’ strategies
Survey respondents are targeting smaller acquisitions, at a time when market cap rates are narrowing for different product types.

Market Data | Apr 4, 2016
ABC: Nonresidential spending slip in February no cause for alarm
Spending in the nonresidential sector totaled $690.3 billion on a seasonally adjusted, annualized basis in February. The figure is a step back but still significantly higher than one year ago.

Market Data | Mar 30, 2016
10 trends for commercial real estate: JLL report
The report looks at global threats and opportunities, and how CRE firms are managing their expectations for growth.

Market Data | Mar 23, 2016
AIA: Modest expansion for Architecture Billings Index
Business conditions softening most in Midwest in recent months.

Retail Centers | Mar 16, 2016
Food and technology will help tomorrow’s malls survive, says CallisonRTKL
CallisonRTKL foresees future retail centers as hubs with live/work/play components.

Market Data | Mar 6, 2016
Real estate execs measure success by how well they manage ‘talent,’ costs, and growth
A new CBRE survey finds more companies leaning toward “smarter” workspaces.

Market Data | Mar 1, 2016
ABC: Nonresidential spending regains momentum in January
Nonresidential construction spending expanded 2.5% on a monthly basis and 12.3% on a yearly basis, totaling $701.9 billion. Spending increased in January in 10 of 16 nonresidential construction sectors.

Market Data | Mar 1, 2016
Leopardo releases 2016 Construction Economics Report
This year’s report shows that spending in 2015 reached the highest level since the Great Recession. Total spending on U.S. construction grew 10.5% to $1.1 trillion, the largest year-over-year gain since 2007.

Market Data | Feb 26, 2016
JLL upbeat about construction through 2016
Its latest report cautions about ongoing cost increases related to finding skilled laborers.


