

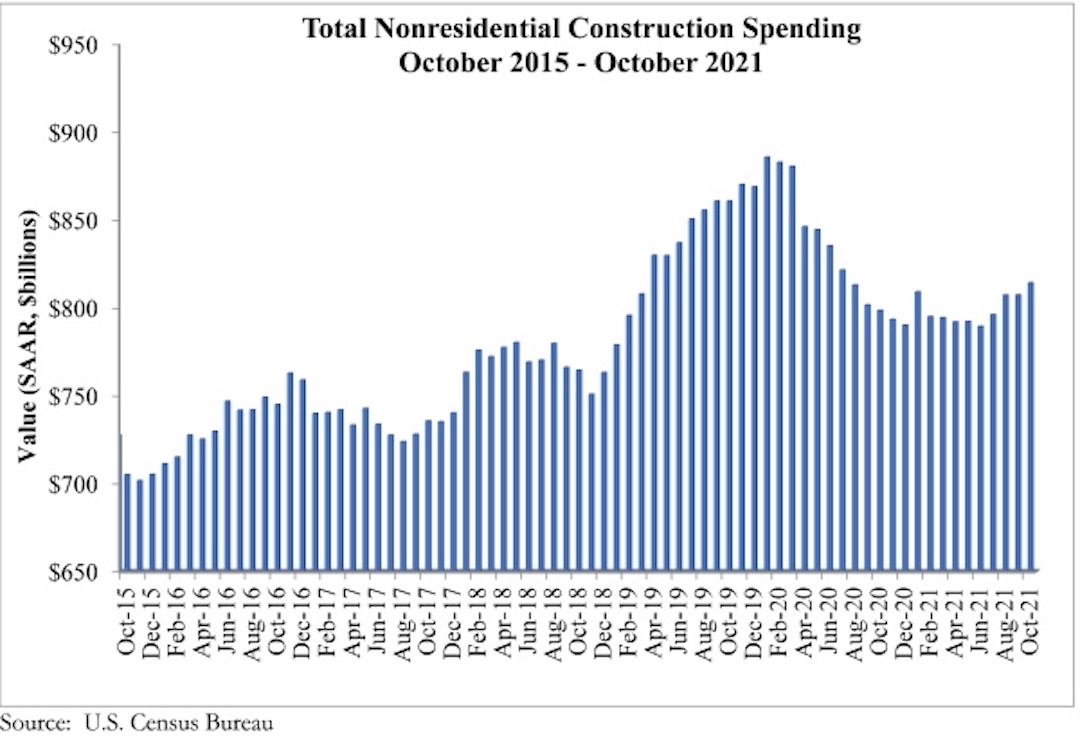
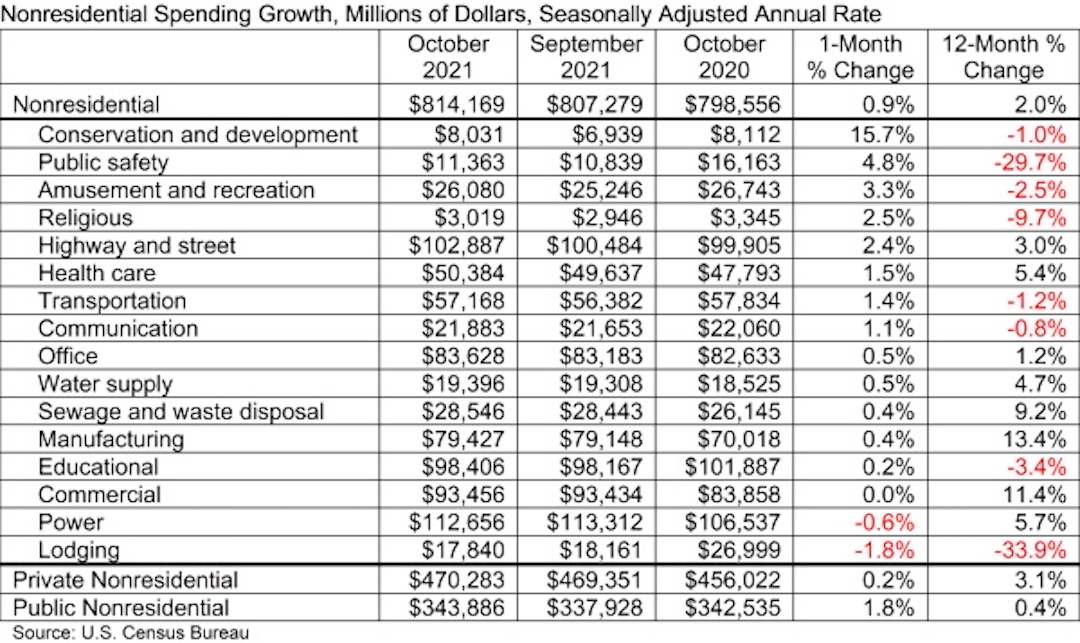
National nonresidential construction spending was up 0.9% in October, according to an Associated Builders and Contractors analysis of data published today by the U.S. Census Bureau. On a seasonally adjusted annualized basis, nonresidential spending totaled $814.2 billion for the month.
Spending was up on a monthly basis in 13 of the 16 nonresidential subcategories, with spending in the commercial subcategory virtually unchanged for the month. Private nonresidential spending was up slightly by 0.2%, while public nonresidential construction spending increased 1.8% in October.
“On the surface, there is much to be encouraged by in October’s construction spending data,” said ABC Chief Economist Anirban Basu. “Nonresidential spending is now at its highest level since July 2020 and has rebounded 3.1% since bottoming out in June 2021. Nonresidential spending expanded meaningfully for the month and those gains were spread across most subsectors. Data characterizing the two prior months were upwardly revised by a combined $27 billion, or 1.7%.
“But construction data do not adjust for inflation, and these spending gains are largely attributable to increases in the cost of delivering construction services,” said Basu. “Challenges that have suppressed nonresidential construction spending growth remain firmly in place. While lofty levels of investment in real estate would normally be associated with significant private construction volumes, many project owners have been induced to postpone projects because of elevated material and labor costs as well as widespread shortages.
“Still, leading indicators remain positive,” said Basu. “ABC members collectively expect revenues and employment levels to climb during the months ahead, according to ABC’s Construction Confidence Index. Design work is plentiful, which means that many investors are at least considering moving forward with projects. In certain geographies, especially in the southern United States, office and other segments are improving, which should translate into more abundant construction starts once global supply chains and materials prices normalize. In this regard, the emergence of the omicron variant adds another layer of uncertainty and may prevent certain materials and equipment prices from declining in the very near term.
“The bottom line is that 2022 should be an excellent year for nonresidential construction,” said Basu. “Performance will be led by public construction, especially in the context of a recently passed and large infrastructure package. Among the segments that are set to zoom ahead are roads and bridges, school construction, water systems, airports, seaports and rail. Traditional office and lodging construction will likely remain weak in much of the nation, however.”

Related Stories

Engineers | May 3, 2017
At first buoyed by Trump election, U.S. engineers now less optimistic about markets, new survey shows
The first quarter 2017 (Q1/17) of ACEC’s Engineering Business Index (EBI) dipped slightly (0.5 points) to 66.0.

Market Data | May 2, 2017
Nonresidential Spending loses steam after strong start to year
Spending in the segment totaled $708.6 billion on a seasonally adjusted, annualized basis.

Market Data | May 1, 2017
Nonresidential Fixed Investment surges despite sluggish economic in first quarter
Real gross domestic product (GDP) expanded 0.7 percent on a seasonally adjusted annualized rate during the first three months of the year.

Industry Research | Apr 28, 2017
A/E Industry lacks planning, but still spending large on hiring
The average 200-person A/E Firm is spending $200,000 on hiring, and not budgeting at all.

Market Data | Apr 19, 2017
Architecture Billings Index continues to strengthen
Balanced growth results in billings gains in all regions.

Market Data | Apr 13, 2017
2016’s top 10 states for commercial development
Three new states creep into the top 10 while first and second place remain unchanged.

Market Data | Apr 6, 2017
Architecture marketing: 5 tools to measure success
We’ve identified five architecture marketing tools that will help your firm evaluate if it’s on the track to more leads, higher growth, and broader brand visibility.

Market Data | Apr 3, 2017
Public nonresidential construction spending rebounds; overall spending unchanged in February
The segment totaled $701.9 billion on a seasonally adjusted annualized rate for the month, marking the seventh consecutive month in which nonresidential spending sat above the $700 billion threshold.

Market Data | Mar 29, 2017
Contractor confidence ends 2016 down but still in positive territory
Although all three diffusion indices in the survey fell by more than five points they remain well above the threshold of 50, which signals that construction activity will continue to be one of the few significant drivers of economic growth.

Market Data | Mar 24, 2017
These are the most and least innovative states for 2017
Connecticut, Virginia, and Maryland are all in the top 10 most innovative states, but none of them were able to claim the number one spot.


