

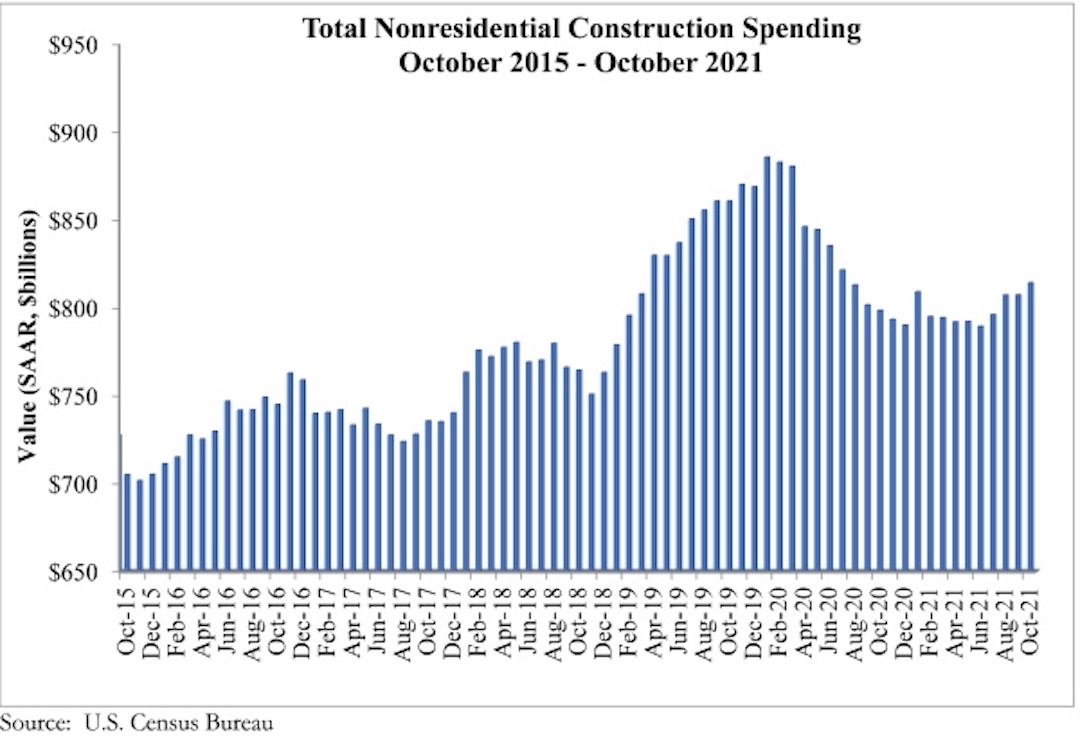
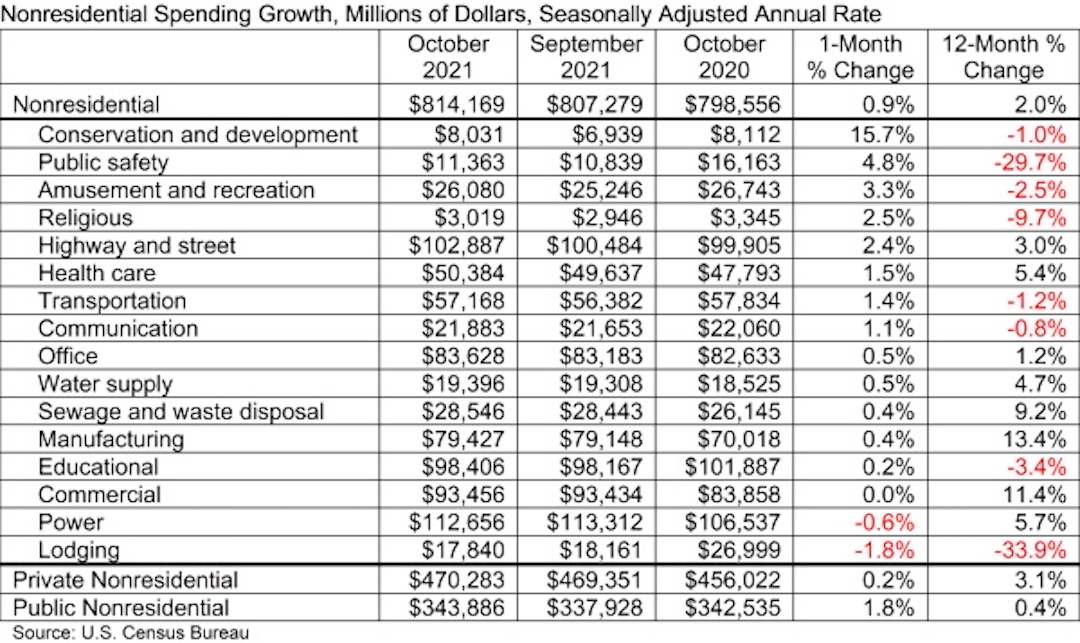
National nonresidential construction spending was up 0.9% in October, according to an Associated Builders and Contractors analysis of data published today by the U.S. Census Bureau. On a seasonally adjusted annualized basis, nonresidential spending totaled $814.2 billion for the month.
Spending was up on a monthly basis in 13 of the 16 nonresidential subcategories, with spending in the commercial subcategory virtually unchanged for the month. Private nonresidential spending was up slightly by 0.2%, while public nonresidential construction spending increased 1.8% in October.
“On the surface, there is much to be encouraged by in October’s construction spending data,” said ABC Chief Economist Anirban Basu. “Nonresidential spending is now at its highest level since July 2020 and has rebounded 3.1% since bottoming out in June 2021. Nonresidential spending expanded meaningfully for the month and those gains were spread across most subsectors. Data characterizing the two prior months were upwardly revised by a combined $27 billion, or 1.7%.
“But construction data do not adjust for inflation, and these spending gains are largely attributable to increases in the cost of delivering construction services,” said Basu. “Challenges that have suppressed nonresidential construction spending growth remain firmly in place. While lofty levels of investment in real estate would normally be associated with significant private construction volumes, many project owners have been induced to postpone projects because of elevated material and labor costs as well as widespread shortages.
“Still, leading indicators remain positive,” said Basu. “ABC members collectively expect revenues and employment levels to climb during the months ahead, according to ABC’s Construction Confidence Index. Design work is plentiful, which means that many investors are at least considering moving forward with projects. In certain geographies, especially in the southern United States, office and other segments are improving, which should translate into more abundant construction starts once global supply chains and materials prices normalize. In this regard, the emergence of the omicron variant adds another layer of uncertainty and may prevent certain materials and equipment prices from declining in the very near term.
“The bottom line is that 2022 should be an excellent year for nonresidential construction,” said Basu. “Performance will be led by public construction, especially in the context of a recently passed and large infrastructure package. Among the segments that are set to zoom ahead are roads and bridges, school construction, water systems, airports, seaports and rail. Traditional office and lodging construction will likely remain weak in much of the nation, however.”

Related Stories

Market Data | Jan 23, 2019
Architecture billings slow, but close 2018 with growing demand
AIA’s Architecture Billings Index (ABI) score for December was 50.4 compared to 54.7 in November.

Market Data | Jan 16, 2019
AIA 2019 Consensus Forecast: Nonresidential construction spending to rise 4.4%
The education, public safety, and office sectors will lead the growth areas this year, but AIA's Kermit Baker offers a cautious outlook for 2020.

Market Data | Dec 19, 2018
Brokers look forward to a commercial real estate market that mirrors 2018’s solid results
Respondents to a recent Transwestern poll expect flat to modest growth for rents and investment in offices, MOBs, and industrial buildings.

Market Data | Dec 19, 2018
When it comes to economic clout, New York will far outpace other U.S. metros for decades to come
But San Jose, Calif., is expected to have the best annual growth rate through 2035, according to Oxford Economics’ latest Global Cities report.

Market Data | Dec 19, 2018
Run of positive billings continues at architecture firms
November marked the fourteenth consecutive month of increasing demand for architectural firm services.

Market Data | Dec 5, 2018
ABC predicts construction sector will remain strong in 2019
Job growth, high backlog and healthy infrastructure investment all spell good news for the industry.

Market Data | Dec 4, 2018
Nonresidential spending rises modestly in October
Thirteen out of 16 subsectors are associated with year-over-year increases.

Market Data | Nov 20, 2018
Construction employment rises from October 2017 to October 2018 in 44 states and D.C.
Texas has biggest annual job increase while New Jersey continues losses; Iowa, Florida and California have largest one-month gains as Mississippi and Louisiana trail.

Market Data | Nov 15, 2018
Architecture firm billings continue to slow, but remain positive in October
Southern region reports decline in billings for the first time since June 2012.

Market Data | Nov 14, 2018
A new Joint Center report finds aging Americans less prepared to afford housing
The study foresees a significant segment of seniors struggling to buy or rent on their own or with other people.


