

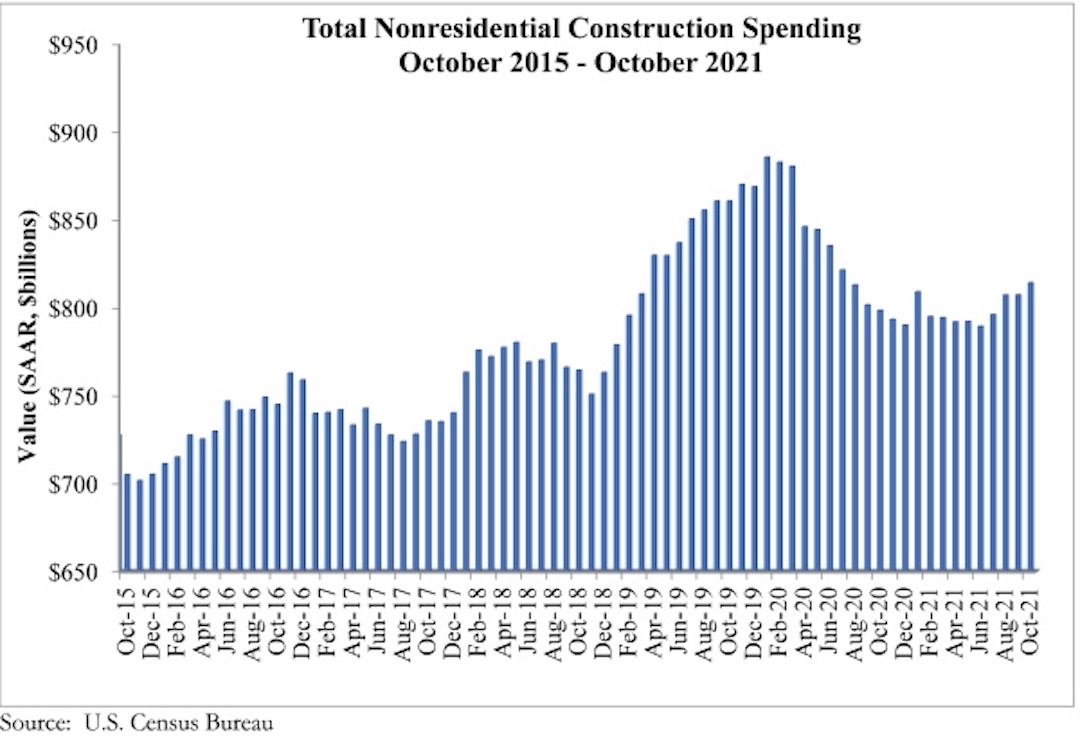
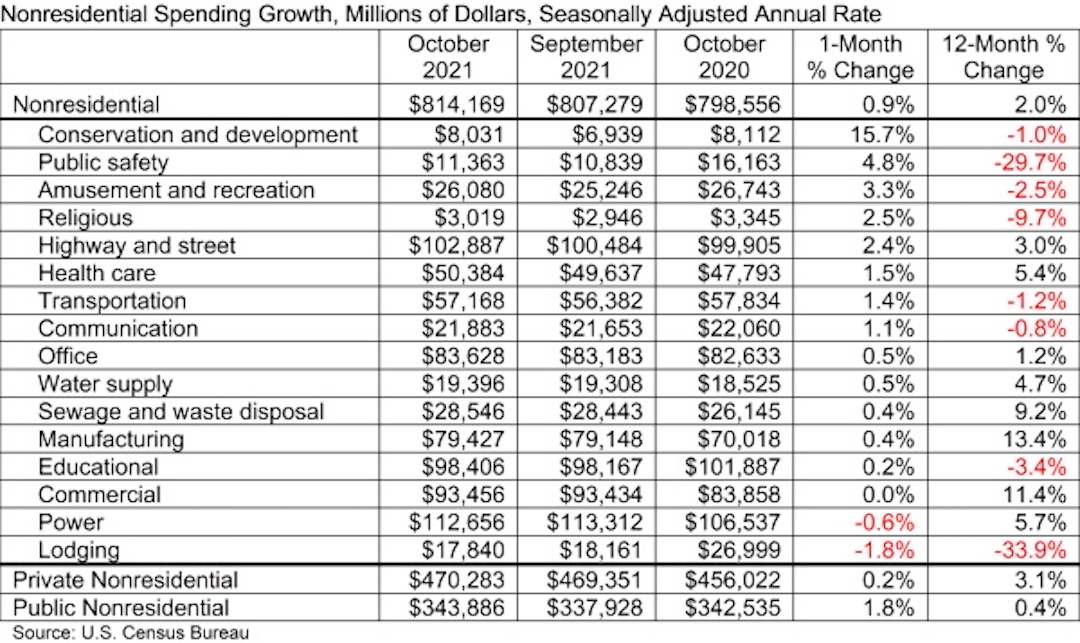
National nonresidential construction spending was up 0.9% in October, according to an Associated Builders and Contractors analysis of data published today by the U.S. Census Bureau. On a seasonally adjusted annualized basis, nonresidential spending totaled $814.2 billion for the month.
Spending was up on a monthly basis in 13 of the 16 nonresidential subcategories, with spending in the commercial subcategory virtually unchanged for the month. Private nonresidential spending was up slightly by 0.2%, while public nonresidential construction spending increased 1.8% in October.
“On the surface, there is much to be encouraged by in October’s construction spending data,” said ABC Chief Economist Anirban Basu. “Nonresidential spending is now at its highest level since July 2020 and has rebounded 3.1% since bottoming out in June 2021. Nonresidential spending expanded meaningfully for the month and those gains were spread across most subsectors. Data characterizing the two prior months were upwardly revised by a combined $27 billion, or 1.7%.
“But construction data do not adjust for inflation, and these spending gains are largely attributable to increases in the cost of delivering construction services,” said Basu. “Challenges that have suppressed nonresidential construction spending growth remain firmly in place. While lofty levels of investment in real estate would normally be associated with significant private construction volumes, many project owners have been induced to postpone projects because of elevated material and labor costs as well as widespread shortages.
“Still, leading indicators remain positive,” said Basu. “ABC members collectively expect revenues and employment levels to climb during the months ahead, according to ABC’s Construction Confidence Index. Design work is plentiful, which means that many investors are at least considering moving forward with projects. In certain geographies, especially in the southern United States, office and other segments are improving, which should translate into more abundant construction starts once global supply chains and materials prices normalize. In this regard, the emergence of the omicron variant adds another layer of uncertainty and may prevent certain materials and equipment prices from declining in the very near term.
“The bottom line is that 2022 should be an excellent year for nonresidential construction,” said Basu. “Performance will be led by public construction, especially in the context of a recently passed and large infrastructure package. Among the segments that are set to zoom ahead are roads and bridges, school construction, water systems, airports, seaports and rail. Traditional office and lodging construction will likely remain weak in much of the nation, however.”

Related Stories

Market Data | Aug 19, 2019
Multifamily market sustains positive cycle
Year-over-year growth tops 3% for 13th month. Will the economy stifle momentum?

Market Data | Aug 16, 2019
Students say unclean restrooms impact their perception of the school
The findings are part of Bradley Corporation’s Healthy Hand Washing Survey.

Market Data | Aug 12, 2019
Mid-year economic outlook for nonresidential construction: Expansion continues, but vulnerabilities pile up
Emerging weakness in business investment has been hinting at softening outlays.

Market Data | Aug 7, 2019
National office vacancy holds steady at 9.7% in slowing but disciplined market
Average asking rental rate posts 4.2% annual growth.

Market Data | Aug 1, 2019
Nonresidential construction spending slows in June, remains elevated
Among the 16 nonresidential construction spending categories tracked by the Census Bureau, seven experienced increases in monthly spending.

Market Data | Jul 31, 2019
For the second quarter of 2019, the U.S. hotel construction pipeline continued its year-over-year growth spurt
The growth spurt continued even as business investment declined for the first time since 2016.

Market Data | Jul 23, 2019
Despite signals of impending declines, continued growth in nonresidential construction is expected through 2020
AIA’s latest Consensus Construction Forecast predicts growth.

Market Data | Jul 20, 2019
Construction costs continued to rise in second quarter
Labor availability is a big factor in that inflation, according to Rider Levett Bucknall report.

Market Data | Jul 18, 2019
Construction contractors remain confident as summer begins
Contractors were slightly less upbeat regarding profit margins and staffing levels compared to April.

Market Data | Jul 17, 2019
Design services demand stalled in June
Project inquiry gains hit a 10-year low.


