flexiblefullpage
billboard
interstitial1
catfish1
Currently Reading

Nonresidential construction spending falters in November

Market Data

Nonresidential construction spending falters in November

Only 4 of 16 subsectors showed gains


By John Caulfield, Senior Editor | January 5, 2016

The latter months of 2015 showed signs that construction spending's momentum had leveled off. Courtesy of Pixabay

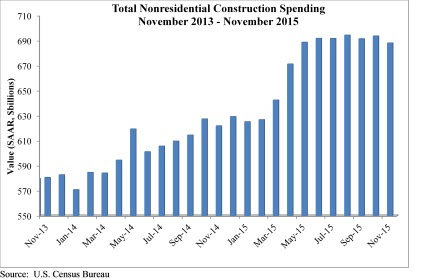
Spending for nonresidential construction, which had been on the uptick for most of 2015, stumbled in the latter months. 

The Census Bureau revised downward its spending estimates for September and October, and reported that spending in November stood at a seasonally adjusted annualized rate of $688.1 billion, down 0.8% from the lower October figure. 
 
Even though it was still up from November 2014's annualized rate of around $625 billion, November 2015 was the industry's worst-performing month since April 2015. 
 
Anirban Basu, chief economist for Associated Builders and Contractors (ABC), called Census's latest data “ominous,” because it showed that spending momentum “has softened considerably in recent months.” He added that ABC's surveys of construction executives paint a more dire picture of the industry's state.


“The most recent data suggest that while 2016 may be a year of nonresidential construction spending growth, it may not provide the degree of momentum that characterized much of 2015,” Basu said. He pointed specifically to construction related to the manufacturing sector, which in November was off 28.8% from November 2014. He believes this downturn reflects falling exports and stiffer competition from foreign producers.
 
ABC's analysis of Census's data found that only four of 16 construction subsectors showed positive gains in November: Communication, which was up 4.4% over October and 27.8% over November 2014; Education (up 3.9% and 13.8%), Office (1.6% and 20.5%), and Transportation (0.2% and 3.1%).
 
Conversely, spending for Public Safety projects fell 8.1% on a monthly basis, and 5.2% year over year. Even Healthcare, which had been the industry's shining light recently (it was up 5% from November 2014), slipped by 0.1% from October 2015.

Related Stories

Market Data | Aug 10, 2018

Construction material prices inch down in July

Nonresidential construction input prices increased fell 0.3% in July but are up 9.6% year over year.

Market Data | Aug 9, 2018

Projections reveal nonresidential construction spending to grow

AIA releases latest Consensus Construction Forecast.

Market Data | Aug 7, 2018

New supply's impact illustrated in Yardi Matrix national self storage report for July

The metro with the most units under construction and planned as a percent of existing inventory in mid-July was Nashville, Tenn.

Market Data | Aug 3, 2018

U.S. multifamily rents reach new heights in July

Favorable economic conditions produce a sunny summer for the apartment sector.

Market Data | Aug 2, 2018

Nonresidential construction spending dips in June

“The hope is that June’s construction spending setback is merely a statistical aberration,” said ABC Chief Economist Anirban Basu.

Market Data | Aug 1, 2018

U.S. hotel construction pipeline continues moderate growth year-over-year

The hotel construction pipeline has been growing moderately and incrementally each quarter.

Market Data | Jul 30, 2018

Nonresidential fixed investment surges in second quarter

Nonresidential fixed investment represented an especially important element of second quarter strength in the advance estimate.

Market Data | Jul 11, 2018

Construction material prices increase steadily in June

June represents the latest month associated with rapidly rising construction input prices.

Market Data | Jun 26, 2018

Yardi Matrix examines potential regional multifamily supply overload

Outsize development activity in some major metros could increase vacancy rates and stagnate rent growth.

Market Data | Jun 22, 2018

Multifamily market remains healthy – Can it be sustained?

New report says strong economic fundamentals outweigh headwinds.

boombox1
boombox2
native1

More In Category

Healthcare Facilities

Watch on-demand: Key Trends in the Healthcare Facilities Market for 2024-2025

Join the Building Design+Construction editorial team for this on-demand webinar on key trends, innovations, and opportunities in the $65 billion U.S. healthcare buildings market. A panel of healthcare design and construction experts present their latest projects, trends, innovations, opportunities, and data/research on key healthcare facilities sub-sectors. A 2024-2025 U.S. healthcare facilities market outlook is also presented.


halfpage1

Most Popular Content

  1. 2021 Giants 400 Report
  2. Top 150 Architecture Firms for 2019
  3. 13 projects that represent the future of affordable housing
  4. Sagrada Familia completion date pushed back due to coronavirus
  5. Top 160 Architecture Firms 2021