flexiblefullpage
billboard
interstitial1
catfish1
Currently Reading

Nonresidential construction spending falters in November

Market Data

Nonresidential construction spending falters in November

Only 4 of 16 subsectors showed gains


By John Caulfield, Senior Editor | January 5, 2016

The latter months of 2015 showed signs that construction spending's momentum had leveled off. Courtesy of Pixabay

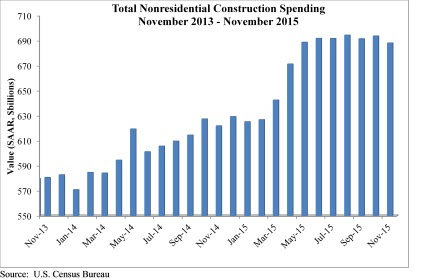
Spending for nonresidential construction, which had been on the uptick for most of 2015, stumbled in the latter months. 

The Census Bureau revised downward its spending estimates for September and October, and reported that spending in November stood at a seasonally adjusted annualized rate of $688.1 billion, down 0.8% from the lower October figure. 
 
Even though it was still up from November 2014's annualized rate of around $625 billion, November 2015 was the industry's worst-performing month since April 2015. 
 
Anirban Basu, chief economist for Associated Builders and Contractors (ABC), called Census's latest data “ominous,” because it showed that spending momentum “has softened considerably in recent months.” He added that ABC's surveys of construction executives paint a more dire picture of the industry's state.


“The most recent data suggest that while 2016 may be a year of nonresidential construction spending growth, it may not provide the degree of momentum that characterized much of 2015,” Basu said. He pointed specifically to construction related to the manufacturing sector, which in November was off 28.8% from November 2014. He believes this downturn reflects falling exports and stiffer competition from foreign producers.
 
ABC's analysis of Census's data found that only four of 16 construction subsectors showed positive gains in November: Communication, which was up 4.4% over October and 27.8% over November 2014; Education (up 3.9% and 13.8%), Office (1.6% and 20.5%), and Transportation (0.2% and 3.1%).
 
Conversely, spending for Public Safety projects fell 8.1% on a monthly basis, and 5.2% year over year. Even Healthcare, which had been the industry's shining light recently (it was up 5% from November 2014), slipped by 0.1% from October 2015.

Related Stories

Market Data | Jul 17, 2019

Design services demand stalled in June

Project inquiry gains hit a 10-year low.

Market Data | Jul 16, 2019

ABC’s Construction Backlog Indicator increases modestly in May

The Construction Backlog Indicator expanded to 8.9 months in May 2019.

K-12 Schools | Jul 15, 2019

Summer assignments: 2019 K-12 school construction costs

Using RSMeans data from Gordian, here are the most recent costs per square foot for K-12 school buildings in 10 cities across the U.S.

Market Data | Jul 12, 2019

Construction input prices plummet in June

This is the first time in nearly three years that input prices have fallen on a year-over-year basis.

Market Data | Jul 1, 2019

Nonresidential construction spending slips modestly in May

Among the 16 nonresidential construction spending categories tracked by the Census Bureau, five experienced increases in monthly spending.

Market Data | Jul 1, 2019

Almost 60% of the U.S. construction project pipeline value is concentrated in 10 major states

With a total of 1,302 projects worth $524.6 billion, California has both the largest number and value of projects in the U.S. construction project pipeline.

Market Data | Jun 21, 2019

Architecture billings remain flat

AIA’s Architecture Billings Index (ABI) score for May showed a small increase in design services at 50.2.

Market Data | Jun 19, 2019

Number of U.S. architects continues to rise

New data from NCARB reveals that the number of architects continues to increase. 

Market Data | Jun 12, 2019

Construction input prices see slight increase in May

Among the 11 subcategories, six saw prices fall last month, with the largest decreases in natural gas.

Market Data | Jun 3, 2019

Nonresidential construction spending up 6.4% year over year in April

Among the 16 sectors tracked by the U.S. Census Bureau, nine experienced an increase in monthly spending, led by water supply and highway and street.

boombox1
boombox2
native1

More In Category

Healthcare Facilities

Watch on-demand: Key Trends in the Healthcare Facilities Market for 2024-2025

Join the Building Design+Construction editorial team for this on-demand webinar on key trends, innovations, and opportunities in the $65 billion U.S. healthcare buildings market. A panel of healthcare design and construction experts present their latest projects, trends, innovations, opportunities, and data/research on key healthcare facilities sub-sectors. A 2024-2025 U.S. healthcare facilities market outlook is also presented.


halfpage1

Most Popular Content

  1. 2021 Giants 400 Report
  2. Top 150 Architecture Firms for 2019
  3. 13 projects that represent the future of affordable housing
  4. Sagrada Familia completion date pushed back due to coronavirus
  5. Top 160 Architecture Firms 2021