flexiblefullpage
billboard
interstitial1
catfish1
Currently Reading

Nonresidential construction spending falters in November

Market Data

Nonresidential construction spending falters in November

Only 4 of 16 subsectors showed gains


By John Caulfield, Senior Editor | January 5, 2016

The latter months of 2015 showed signs that construction spending's momentum had leveled off. Courtesy of Pixabay

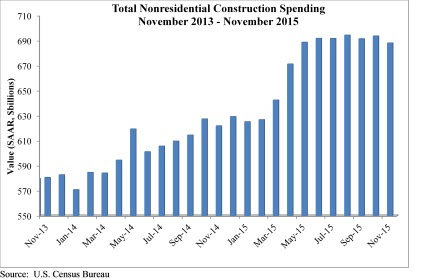
Spending for nonresidential construction, which had been on the uptick for most of 2015, stumbled in the latter months. 

The Census Bureau revised downward its spending estimates for September and October, and reported that spending in November stood at a seasonally adjusted annualized rate of $688.1 billion, down 0.8% from the lower October figure. 
 
Even though it was still up from November 2014's annualized rate of around $625 billion, November 2015 was the industry's worst-performing month since April 2015. 
 
Anirban Basu, chief economist for Associated Builders and Contractors (ABC), called Census's latest data “ominous,” because it showed that spending momentum “has softened considerably in recent months.” He added that ABC's surveys of construction executives paint a more dire picture of the industry's state.


“The most recent data suggest that while 2016 may be a year of nonresidential construction spending growth, it may not provide the degree of momentum that characterized much of 2015,” Basu said. He pointed specifically to construction related to the manufacturing sector, which in November was off 28.8% from November 2014. He believes this downturn reflects falling exports and stiffer competition from foreign producers.
 
ABC's analysis of Census's data found that only four of 16 construction subsectors showed positive gains in November: Communication, which was up 4.4% over October and 27.8% over November 2014; Education (up 3.9% and 13.8%), Office (1.6% and 20.5%), and Transportation (0.2% and 3.1%).
 
Conversely, spending for Public Safety projects fell 8.1% on a monthly basis, and 5.2% year over year. Even Healthcare, which had been the industry's shining light recently (it was up 5% from November 2014), slipped by 0.1% from October 2015.

Related Stories

Market Data | Apr 13, 2021

ABC’s Construction Backlog slips in March; Contractor optimism continues to improve

The Construction Backlog Indicator fell to 7.8 months in March.

Market Data | Apr 9, 2021

Record jump in materials prices and supply chain distributions threaten construction firms' ability to complete vital nonresidential projects

A government index that measures the selling price for goods used construction jumped 3.5% from February to March.

Contractors | Apr 9, 2021

Construction bidding activity ticks up in February

The Blue Book Network's Velocity Index measures month-to-month changes in bidding activity among construction firms across five building sectors and in all 50 states. 

Industry Research | Apr 9, 2021

BD+C exclusive research: What building owners want from AEC firms

BD+C’s first-ever owners’ survey finds them focused on improving buildings’ performance for higher investment returns.

Market Data | Apr 7, 2021

Construction employment drops in 236 metro areas between February 2020 and February 2021

Houston-The Woodlands-Sugar Land and Odessa, Texas have worst 12-month employment losses.

Market Data | Apr 2, 2021

Nonresidential construction spending down 1.3% in February, says ABC

On a monthly basis, spending was down in 13 of 16 nonresidential subcategories.

Market Data | Apr 1, 2021

Construction spending slips in February

Shrinking demand, soaring costs, and supply delays threaten project completion dates and finances.

Market Data | Mar 26, 2021

Construction employment in February trails pre-pandemic level in 44 states

Soaring costs, supply-chain problems jeopardize future jobs.

Market Data | Mar 24, 2021

Architecture billings climb into positive territory after a year of monthly declines

AIA’s ABI score for February was 53.3 compared to 44.9 in January.

Market Data | Mar 22, 2021

Construction employment slips in 225 metros from January 2020 to January 2021

Rampant cancellations augur further declines ahead.

boombox1
boombox2
native1

More In Category

Healthcare Facilities

Watch on-demand: Key Trends in the Healthcare Facilities Market for 2024-2025

Join the Building Design+Construction editorial team for this on-demand webinar on key trends, innovations, and opportunities in the $65 billion U.S. healthcare buildings market. A panel of healthcare design and construction experts present their latest projects, trends, innovations, opportunities, and data/research on key healthcare facilities sub-sectors. A 2024-2025 U.S. healthcare facilities market outlook is also presented.


halfpage1

Most Popular Content

  1. 2021 Giants 400 Report
  2. Top 150 Architecture Firms for 2019
  3. 13 projects that represent the future of affordable housing
  4. Sagrada Familia completion date pushed back due to coronavirus
  5. Top 160 Architecture Firms 2021