flexiblefullpage
billboard
interstitial1
catfish1
Currently Reading

Nonresidential construction spending falters in November

Market Data

Nonresidential construction spending falters in November

Only 4 of 16 subsectors showed gains


By John Caulfield, Senior Editor | January 5, 2016

The latter months of 2015 showed signs that construction spending's momentum had leveled off. Courtesy of Pixabay

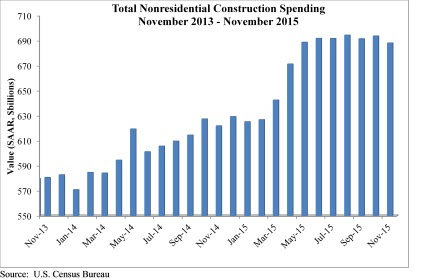
Spending for nonresidential construction, which had been on the uptick for most of 2015, stumbled in the latter months. 

The Census Bureau revised downward its spending estimates for September and October, and reported that spending in November stood at a seasonally adjusted annualized rate of $688.1 billion, down 0.8% from the lower October figure. 
 
Even though it was still up from November 2014's annualized rate of around $625 billion, November 2015 was the industry's worst-performing month since April 2015. 
 
Anirban Basu, chief economist for Associated Builders and Contractors (ABC), called Census's latest data “ominous,” because it showed that spending momentum “has softened considerably in recent months.” He added that ABC's surveys of construction executives paint a more dire picture of the industry's state.


“The most recent data suggest that while 2016 may be a year of nonresidential construction spending growth, it may not provide the degree of momentum that characterized much of 2015,” Basu said. He pointed specifically to construction related to the manufacturing sector, which in November was off 28.8% from November 2014. He believes this downturn reflects falling exports and stiffer competition from foreign producers.
 
ABC's analysis of Census's data found that only four of 16 construction subsectors showed positive gains in November: Communication, which was up 4.4% over October and 27.8% over November 2014; Education (up 3.9% and 13.8%), Office (1.6% and 20.5%), and Transportation (0.2% and 3.1%).
 
Conversely, spending for Public Safety projects fell 8.1% on a monthly basis, and 5.2% year over year. Even Healthcare, which had been the industry's shining light recently (it was up 5% from November 2014), slipped by 0.1% from October 2015.

Related Stories

Market Data | Sep 7, 2021

Construction sheds 3,000 jobs in August

Gains are limited to homebuilding as other contractors struggle to fill both craft and salaried positions.

Market Data | Sep 3, 2021

Construction workforce shortages reach pre-pandemic levels

Coronavirus continues to impact projects and disrupt supply chains.

Multifamily Housing | Sep 1, 2021

Top 10 outdoor amenities at multifamily housing developments for 2021

Fire pits, lounge areas, and covered parking are the most common outdoor amenities at multifamily housing developments, according to new research from Multifamily Design+Construction.

Market Data | Sep 1, 2021

Construction spending posts small increase in July

Coronavirus, soaring costs, and supply disruptions threaten to erase further gains.

Market Data | Sep 1, 2021

Bradley Corp. survey finds office workers taking coronavirus precautions

Due to the rise in new strains of the virus, 70% of office workers have implemented a more rigorous handwashing regimen versus 59% of the general population.

Market Data | Aug 31, 2021

Three out of four metro areas add construction jobs from July 2020 to July 2021

COVID, rising costs, and supply chain woes may stall gains.

Market Data | Aug 24, 2021

July construction employment lags pre-pandemic peak in 36 states

Delta variant of coronavirus threatens to hold down further gains.

Market Data | Aug 17, 2021

Demand for design activity continues to expand

The ABI score for July was 54.6.

Market Data | Aug 12, 2021

Steep rise in producer prices for construction materials and services continues in July.

The producer price index for new nonresidential construction rose 4.4% over the past 12 months.

Market Data | Aug 6, 2021

Construction industry adds 11,000 jobs in July

Nonresidential sector trails overall recovery.

boombox1
boombox2
native1

More In Category


halfpage1

Most Popular Content

  1. 2021 Giants 400 Report
  2. Top 150 Architecture Firms for 2019
  3. 13 projects that represent the future of affordable housing
  4. Sagrada Familia completion date pushed back due to coronavirus
  5. Top 160 Architecture Firms 2021