


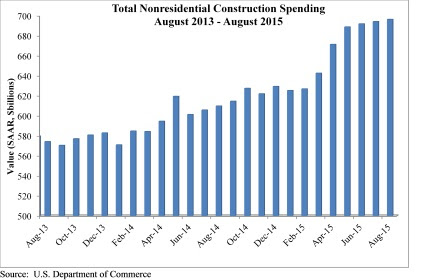
August marked the seventh consecutive month nonresidential construction spending expanded according to an Oct. 1 release supplied by the U.S. Census Bureau. Nonresidential spending totaled $696.3 billion on a seasonally adjusted, annualized basis in August, a 0.3% increase from the previous month and a 12.3% increase from the same time last year. The Census Bureau downwardly revised July's estimate from $696.1 billion to $694.1 billion.
"Job growth is fueling both consumer spending and the absorption of space, all of this is good for construction spending," said Associated Builders and Contractors Chief Economist Anirban Basu. "While construction spending has expanded by more than 12% over the past year, that is not to suggest that macroeconomic risks do not abound. Interest rates are likely to head higher going forward and there is no guarantee that energy prices will remain subdued. While low energy prices have caused some regional economies to slow, investment and spending has been bolstered in others.
"Recently, much attention has been focused on the global economic slowdown and the volatility of financial markets," said Basu. "The Federal Reserve's recent decision not to increase interest rates supported a developing narrative which suggests that the weakness now apparent in much of the world will eventually bring the U.S. into another recession."
Eight of 16 nonresidential construction sectors experienced spending increases in August on a monthly basis:
- Lodging-related construction spending expanded 2.8% on a monthly basis and 41.4% on a year–over-year basis
- Health care-related construction spending grew 1.9% on a monthly basis and 9.1% on a yearly basis
- Public safety-related construction spending expanded 0.4% in August and is 0.2% higher than last year
- Spending in the amusement and recreation category grew 1.3% for the month and 34.7% from the same time last year
- Transportation-related construction spending grew 1.4% in August and is up 12.1% from the same time last year
- Communication-related construction spending is up 0.4% for the month and 11.5% on a yearly basis
- Power-related construction spending expanded 1.2% month-over month but is down 6.7% year-over-year
- Manufacturing-related construction spending expanded 1.3% on a monthly basis and 57.6% on a yearly basis
Spending in half of the nonresidential construction subsectors fell in August on a monthly basis:
- Highway and street-related construction spending fell by 0.6% in August but is up 7% from the same time last year
- Sewage and waste disposal-related construction spending is 0.3% lower from July 2015 but 9% higher than in August 2014
- Water supply-related construction spending is down 0.2% for the month but is up 4.9% over the past 12 months
- Conservation and development-related construction spending fell 0.9% for the month but is up 12.7% from the same time last year
- Office-related construction spending dipped 0.2% lower in August but is up 25.4% since the same time last year
- Spending in the commercial category fell 1.2% for the month but grew 1.3% over the past 12 months
- Educational-related construction spending inched 0.6% lower for the month but is up 5.0% year-over-year
- Religious-related construction spending fell 9.4% for the month and 4.6% from August 2014
To view the previous spending report, click here.
Related Stories

| Dec 20, 2011
Gluckman Mayner Architects releases design for Syracuse law building
The design reflects an organizational clarity and professional sophistication that anticipates the user experience of students, faculty, and visitors alike.

| Dec 20, 2011
Research identifies most expensive U.S. commercial real estate markets
New York City, Washington, D.C. and San Mateo, Calif., rank highest in rents.

| Dec 20, 2011
Third annual Gingerbread Build-off winners announced
Nine awards were handed out acknowledging the most unique and creative gingerbread structures completed.


| Dec 20, 2011
BCA’s Best Practices in New Construction available online
This publicly available document is applicable to most building types and distills the long list of guidelines, and longer list of tasks, into easy-to-navigate activities that represent the ideal commissioning process.

| Dec 20, 2011
Aragon Construction leading build-out of foursquare office
The modern, minimalist build-out will have elements of the foursquare “badges” in different aspects of the space, using glass, steel, and vibrantly painted gypsum board.

| Dec 20, 2011
HOAR Construction opens Austin, Texas office
Major projects in central Texas spur firm’s growth.

| Dec 19, 2011
HGA renovates Rowing Center at Cornell University
Renovation provides state-of-the-art waterfront facility.

| Dec 19, 2011
Chicago’s Aqua Tower wins international design award
Aqua was named both regional and international winner of the International Property Award as Best Residential High-Rise Development.

| Dec 19, 2011
Summit Design+Build selected as GC for Chicago recon project
The 130,000 square foot building is being completely renovated.


