


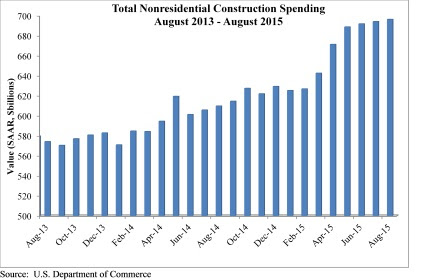
August marked the seventh consecutive month nonresidential construction spending expanded according to an Oct. 1 release supplied by the U.S. Census Bureau. Nonresidential spending totaled $696.3 billion on a seasonally adjusted, annualized basis in August, a 0.3% increase from the previous month and a 12.3% increase from the same time last year. The Census Bureau downwardly revised July's estimate from $696.1 billion to $694.1 billion.
"Job growth is fueling both consumer spending and the absorption of space, all of this is good for construction spending," said Associated Builders and Contractors Chief Economist Anirban Basu. "While construction spending has expanded by more than 12% over the past year, that is not to suggest that macroeconomic risks do not abound. Interest rates are likely to head higher going forward and there is no guarantee that energy prices will remain subdued. While low energy prices have caused some regional economies to slow, investment and spending has been bolstered in others.
"Recently, much attention has been focused on the global economic slowdown and the volatility of financial markets," said Basu. "The Federal Reserve's recent decision not to increase interest rates supported a developing narrative which suggests that the weakness now apparent in much of the world will eventually bring the U.S. into another recession."
Eight of 16 nonresidential construction sectors experienced spending increases in August on a monthly basis:
- Lodging-related construction spending expanded 2.8% on a monthly basis and 41.4% on a year–over-year basis
- Health care-related construction spending grew 1.9% on a monthly basis and 9.1% on a yearly basis
- Public safety-related construction spending expanded 0.4% in August and is 0.2% higher than last year
- Spending in the amusement and recreation category grew 1.3% for the month and 34.7% from the same time last year
- Transportation-related construction spending grew 1.4% in August and is up 12.1% from the same time last year
- Communication-related construction spending is up 0.4% for the month and 11.5% on a yearly basis
- Power-related construction spending expanded 1.2% month-over month but is down 6.7% year-over-year
- Manufacturing-related construction spending expanded 1.3% on a monthly basis and 57.6% on a yearly basis
Spending in half of the nonresidential construction subsectors fell in August on a monthly basis:
- Highway and street-related construction spending fell by 0.6% in August but is up 7% from the same time last year
- Sewage and waste disposal-related construction spending is 0.3% lower from July 2015 but 9% higher than in August 2014
- Water supply-related construction spending is down 0.2% for the month but is up 4.9% over the past 12 months
- Conservation and development-related construction spending fell 0.9% for the month but is up 12.7% from the same time last year
- Office-related construction spending dipped 0.2% lower in August but is up 25.4% since the same time last year
- Spending in the commercial category fell 1.2% for the month but grew 1.3% over the past 12 months
- Educational-related construction spending inched 0.6% lower for the month but is up 5.0% year-over-year
- Religious-related construction spending fell 9.4% for the month and 4.6% from August 2014
To view the previous spending report, click here.
Related Stories

| May 3, 2013
Another edible city? Artist creates model city with chewing gum
French artist Jeremy Laffon pieced together a model city with thousands of sticks of mint-green chewing gum.

| May 2, 2013
First look: UC-Davis art museum by SO-IL and Bohlin Cywinski Jackson
The University of California, Davis has selected emerging New York-based practice SO-IL to design a new campus’ art museum, which is envisioned to be a “regional center of experimentation, participation and learning.”

| May 2, 2013
A snapshot of the world's amazing construction feats (in one flashy infographic)
From the Great Pyramids of Giza to the U.S. Interstate Highway System, this infographic outlines interesting facts about some of the world's most notable construction projects.

| May 2, 2013
Holl-designed Campbell Sports Center completed at Columbia
Steven Holl Architects celebrates the completion of the Campbell Sports Center, Columbia University’s new training and teaching facility.

| May 2, 2013
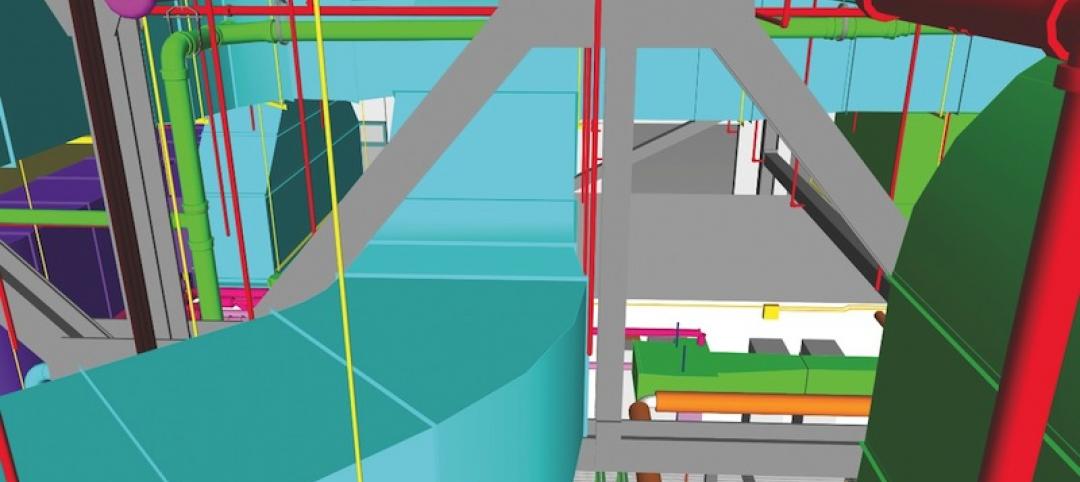
BIM group proposes uniform standards for how complete plans need to be
A nationwide group of Building Information Modeling users, known as the BIMForum, is seeking industry input on a proposed set of standards establishing how complete Building Information Models (BIMs) need to be for different stages of the design and construction process.

| May 2, 2013
New web community aims to revitalize abandoned buildings
Italian innovators Andrea Sesta and Daniela Galvani hope to create a worldwide database of abandoned facilities, ripe for redevelopment, with their [im]possible living internet community.

| May 1, 2013
A LEGO lover's dream: Guide to building the world's iconic structures with LEGO
A new book from LEGO master builder Warren Elsmore offers instructions for creating scale models of buildings and landmarks with LEGO.

| May 1, 2013
Data center construction remains healthy, but oversupply a concern
Facebook, Amazon, Microsoft, and Google are among the major tech companies investing heavily to build state-of-the-art data centers.


