


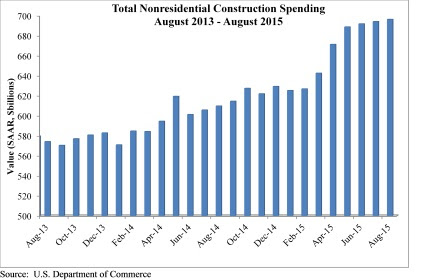
August marked the seventh consecutive month nonresidential construction spending expanded according to an Oct. 1 release supplied by the U.S. Census Bureau. Nonresidential spending totaled $696.3 billion on a seasonally adjusted, annualized basis in August, a 0.3% increase from the previous month and a 12.3% increase from the same time last year. The Census Bureau downwardly revised July's estimate from $696.1 billion to $694.1 billion.
"Job growth is fueling both consumer spending and the absorption of space, all of this is good for construction spending," said Associated Builders and Contractors Chief Economist Anirban Basu. "While construction spending has expanded by more than 12% over the past year, that is not to suggest that macroeconomic risks do not abound. Interest rates are likely to head higher going forward and there is no guarantee that energy prices will remain subdued. While low energy prices have caused some regional economies to slow, investment and spending has been bolstered in others.
"Recently, much attention has been focused on the global economic slowdown and the volatility of financial markets," said Basu. "The Federal Reserve's recent decision not to increase interest rates supported a developing narrative which suggests that the weakness now apparent in much of the world will eventually bring the U.S. into another recession."
Eight of 16 nonresidential construction sectors experienced spending increases in August on a monthly basis:
- Lodging-related construction spending expanded 2.8% on a monthly basis and 41.4% on a year–over-year basis
- Health care-related construction spending grew 1.9% on a monthly basis and 9.1% on a yearly basis
- Public safety-related construction spending expanded 0.4% in August and is 0.2% higher than last year
- Spending in the amusement and recreation category grew 1.3% for the month and 34.7% from the same time last year
- Transportation-related construction spending grew 1.4% in August and is up 12.1% from the same time last year
- Communication-related construction spending is up 0.4% for the month and 11.5% on a yearly basis
- Power-related construction spending expanded 1.2% month-over month but is down 6.7% year-over-year
- Manufacturing-related construction spending expanded 1.3% on a monthly basis and 57.6% on a yearly basis
Spending in half of the nonresidential construction subsectors fell in August on a monthly basis:
- Highway and street-related construction spending fell by 0.6% in August but is up 7% from the same time last year
- Sewage and waste disposal-related construction spending is 0.3% lower from July 2015 but 9% higher than in August 2014
- Water supply-related construction spending is down 0.2% for the month but is up 4.9% over the past 12 months
- Conservation and development-related construction spending fell 0.9% for the month but is up 12.7% from the same time last year
- Office-related construction spending dipped 0.2% lower in August but is up 25.4% since the same time last year
- Spending in the commercial category fell 1.2% for the month but grew 1.3% over the past 12 months
- Educational-related construction spending inched 0.6% lower for the month but is up 5.0% year-over-year
- Religious-related construction spending fell 9.4% for the month and 4.6% from August 2014
To view the previous spending report, click here.
Related Stories

| Jul 19, 2013
Top BIM Architecture Firms [2013 Giants 300 Report]
Gensler, HOK, HDR top Building Design+Construction's 2013 ranking of the architecture and architecture/engineering firms with the most revenue from BIM-driven projects.
 at Michigan State University. The level of detail and coordination required from each of the firms disciplines was unprecedented. FRIB will be a new national user facility for nuclear science, funded by the Department of Energy Office of Science, Michigan State University, and the state of Michigan. PHOTO: SMITHGROUPJJR")
| Jul 19, 2013
BIM 2.0: AEC firms share their vision for the great leap forward in BIM/VDC implementation [2013 Giants 300 Report]
We reached out to dozens of AEC firms that made our annual BIM Giants lists and asked one simple question: What does BIM 2.0 look like to you? Here’s what they had to offer.
| Jul 19, 2013
Reconstruction Sector Construction Firms [2013 Giants 300 Report]
Structure Tone, DPR, Gilbane top Building Design+Construction's 2013 ranking of the largest reconstruction contractor and construction management firms in the U.S.
| Jul 19, 2013
Reconstruction Sector Engineering Firms [2013 Giants 300 Report]
URS, STV, Wiss Janney Elstner top Building Design+Construction's 2013 ranking of the largest reconstruction engineering and engineering/architecture firms in the U.S.
| Jul 19, 2013
Reconstruction Sector Architecture Firms [2013 Giants 300 Report]
Stantec, HOK, HDR top Building Design+Construction's 2013 ranking of the largest reconstruction architecture and architecture/engineering firms in the U.S.

| Jul 19, 2013
Best in brick: 7 stunning building façades made with brick [slideshow]
The Brick Industry Association named the winners of its 2013 Brick in Architecture Awards. Here are seven winning projects that caught our eye.

| Jul 19, 2013
Construction lags other sectors, but momentum is building: JLL report
Although the construction recovery continues to lag other sectors as well as the overall U.S. economy, the industry is finally seeing a rebound. Commercial real estate giant Jones Lang LaSalle recently released its Summer 2013 Construction Highlights report, which found that there are some sectors (such as energy and high-tech) driving demand for construction, while a few major cities are starting to record increased levels of speculative office building developments.

| Jul 19, 2013
Must see: 220 years of development on Capitol Hill in one snazzy 3D flyover video
The Architect of the Capitol this week released a dramatic video timeline of 220 years of building development on Capitol Hill.
| Jul 18, 2013
Top Local Government Sector Construction Firms [2013 Giants 300 Report]
Turner, Clark Group, PCL top Building Design+Construction's 2013 ranking of the largest local government sector contractor and construction management firms in the U.S.
| Jul 18, 2013
Top Local Government Sector Engineering Firms [2013 Giants 300 Report]
STV, URS, AECOM top Building Design+Construction's 2013 ranking of the largest local government sector engineering and engineering/architecture firms in the U.S.


