


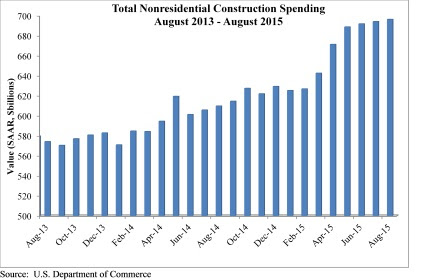
August marked the seventh consecutive month nonresidential construction spending expanded according to an Oct. 1 release supplied by the U.S. Census Bureau. Nonresidential spending totaled $696.3 billion on a seasonally adjusted, annualized basis in August, a 0.3% increase from the previous month and a 12.3% increase from the same time last year. The Census Bureau downwardly revised July's estimate from $696.1 billion to $694.1 billion.
"Job growth is fueling both consumer spending and the absorption of space, all of this is good for construction spending," said Associated Builders and Contractors Chief Economist Anirban Basu. "While construction spending has expanded by more than 12% over the past year, that is not to suggest that macroeconomic risks do not abound. Interest rates are likely to head higher going forward and there is no guarantee that energy prices will remain subdued. While low energy prices have caused some regional economies to slow, investment and spending has been bolstered in others.
"Recently, much attention has been focused on the global economic slowdown and the volatility of financial markets," said Basu. "The Federal Reserve's recent decision not to increase interest rates supported a developing narrative which suggests that the weakness now apparent in much of the world will eventually bring the U.S. into another recession."
Eight of 16 nonresidential construction sectors experienced spending increases in August on a monthly basis:
- Lodging-related construction spending expanded 2.8% on a monthly basis and 41.4% on a year–over-year basis
- Health care-related construction spending grew 1.9% on a monthly basis and 9.1% on a yearly basis
- Public safety-related construction spending expanded 0.4% in August and is 0.2% higher than last year
- Spending in the amusement and recreation category grew 1.3% for the month and 34.7% from the same time last year
- Transportation-related construction spending grew 1.4% in August and is up 12.1% from the same time last year
- Communication-related construction spending is up 0.4% for the month and 11.5% on a yearly basis
- Power-related construction spending expanded 1.2% month-over month but is down 6.7% year-over-year
- Manufacturing-related construction spending expanded 1.3% on a monthly basis and 57.6% on a yearly basis
Spending in half of the nonresidential construction subsectors fell in August on a monthly basis:
- Highway and street-related construction spending fell by 0.6% in August but is up 7% from the same time last year
- Sewage and waste disposal-related construction spending is 0.3% lower from July 2015 but 9% higher than in August 2014
- Water supply-related construction spending is down 0.2% for the month but is up 4.9% over the past 12 months
- Conservation and development-related construction spending fell 0.9% for the month but is up 12.7% from the same time last year
- Office-related construction spending dipped 0.2% lower in August but is up 25.4% since the same time last year
- Spending in the commercial category fell 1.2% for the month but grew 1.3% over the past 12 months
- Educational-related construction spending inched 0.6% lower for the month but is up 5.0% year-over-year
- Religious-related construction spending fell 9.4% for the month and 4.6% from August 2014
To view the previous spending report, click here.
Related Stories

| Aug 14, 2013
Green Building Report [2013 Giants 300 Report]
Building Design+Construction's rankings of the nation's largest green design and construction firms.

| Aug 14, 2013
Military Construction Report [2013 Giants 300 Report]
Building Design+Construction's rankings of the nation's largest military sector design and construction firms, as reported in the 2013 Giants 300 Report.

| Aug 13, 2013
DPR's Phoenix office, designed by SmithGroupJJR, affirmed as world's largest ILFI-certified net-zero facility
The new Phoenix Regional Office of DPR Construction, designed by SmithGroupJJR, has been officially certified as a Net Zero Energy Building by the International Living Future Institute (ILFI). It’s the largest building in the world to achieve Net Zero Energy Building Certification through the Institute to date.

| Aug 13, 2013
USGBC joins forces with Green Sports Alliance to promote sustainable venues
The U.S. Green Building Council (USGBC) has announced a collaboration with the Green Sports Alliance, a prominent nonprofit organization supporting the development and promotion of green building initiatives in professional and collegiate sports.
 and integrates diverse disciplines to attack complex problems of global energy. BP supported the initiative with a $500 million, 10-year grant, and has stationed engineers and scientists to work alongside UCBerkeley researchers. SmithGroupJJR designed the project. PHOTO: BRUCE DAMONTE")
| Aug 8, 2013
Energy research animates science sector [2013 Giants 300 Report]
After an era of biology-oriented spending—largely driven by Big Pharma and government concerns about bioterrorism—climate change is reshaping priorities in science and technology construction.

| Aug 8, 2013
Top Science and Technology Sector Engineering Firms [2013 Giants 300 Report]
Affiliated Engineers, Middough, URS top Building Design+Construction's 2013 ranking of the largest science and technology sector engineering and engineering/architecture firms in the U.S.

| Aug 8, 2013
Top Science and Technology Sector Architecture Firms [2013 Giants 300 Report]
HDR, Perkins+Will, HOK top Building Design+Construction's 2013 ranking of the largest science and technology sector architecture and architecture/engineering firms in the U.S.

| Aug 8, 2013
Top Science and Technology Sector Construction Firms [2013 Giants 300 Report]
Skanska, DPR, Suffolk top Building Design+Construction's 2013 ranking of the largest science and technology sector contractors and construction management firms in the U.S.

| Aug 8, 2013
Level of Development: Will a new standard bring clarity to BIM model detail?
The newly released LOD Specification document allows Building Teams to understand exactly what’s in the BIM model they’re being handed.
| Aug 8, 2013
Vertegy spins off to form independent green consultancy
St. Louis-based Vertegy has announced the formation of Vertegy, LLC, transitioning into an independent company separate from the Alberici Enterprise. The new company was officially unveiled Aug. 1, 2013


