


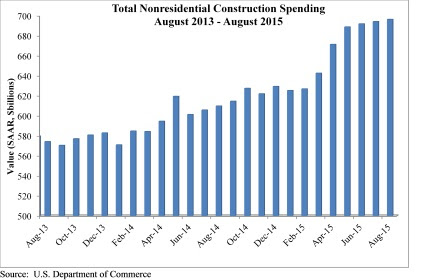
August marked the seventh consecutive month nonresidential construction spending expanded according to an Oct. 1 release supplied by the U.S. Census Bureau. Nonresidential spending totaled $696.3 billion on a seasonally adjusted, annualized basis in August, a 0.3% increase from the previous month and a 12.3% increase from the same time last year. The Census Bureau downwardly revised July's estimate from $696.1 billion to $694.1 billion.
"Job growth is fueling both consumer spending and the absorption of space, all of this is good for construction spending," said Associated Builders and Contractors Chief Economist Anirban Basu. "While construction spending has expanded by more than 12% over the past year, that is not to suggest that macroeconomic risks do not abound. Interest rates are likely to head higher going forward and there is no guarantee that energy prices will remain subdued. While low energy prices have caused some regional economies to slow, investment and spending has been bolstered in others.
"Recently, much attention has been focused on the global economic slowdown and the volatility of financial markets," said Basu. "The Federal Reserve's recent decision not to increase interest rates supported a developing narrative which suggests that the weakness now apparent in much of the world will eventually bring the U.S. into another recession."
Eight of 16 nonresidential construction sectors experienced spending increases in August on a monthly basis:
- Lodging-related construction spending expanded 2.8% on a monthly basis and 41.4% on a year–over-year basis
- Health care-related construction spending grew 1.9% on a monthly basis and 9.1% on a yearly basis
- Public safety-related construction spending expanded 0.4% in August and is 0.2% higher than last year
- Spending in the amusement and recreation category grew 1.3% for the month and 34.7% from the same time last year
- Transportation-related construction spending grew 1.4% in August and is up 12.1% from the same time last year
- Communication-related construction spending is up 0.4% for the month and 11.5% on a yearly basis
- Power-related construction spending expanded 1.2% month-over month but is down 6.7% year-over-year
- Manufacturing-related construction spending expanded 1.3% on a monthly basis and 57.6% on a yearly basis
Spending in half of the nonresidential construction subsectors fell in August on a monthly basis:
- Highway and street-related construction spending fell by 0.6% in August but is up 7% from the same time last year
- Sewage and waste disposal-related construction spending is 0.3% lower from July 2015 but 9% higher than in August 2014
- Water supply-related construction spending is down 0.2% for the month but is up 4.9% over the past 12 months
- Conservation and development-related construction spending fell 0.9% for the month but is up 12.7% from the same time last year
- Office-related construction spending dipped 0.2% lower in August but is up 25.4% since the same time last year
- Spending in the commercial category fell 1.2% for the month but grew 1.3% over the past 12 months
- Educational-related construction spending inched 0.6% lower for the month but is up 5.0% year-over-year
- Religious-related construction spending fell 9.4% for the month and 4.6% from August 2014
To view the previous spending report, click here.
Related Stories
| Jan 16, 2014
ASHRAE revised climatic data for building design standards
ASHRAE Standard 169, Climatic Data for Building Design Standards, now includes climatic data for 5,564 locations throughout the world.

| Jan 15, 2014
6 social media skills every leader needs
The social media revolution—which is less than a decade old—has created a dilemma for senior executives. While its potential seems immense, the inherent risks create uncertainty and unease.

| Jan 15, 2014
Report: 32 U.S. buildings have been verified as net-zero energy performers
The New Buildings Institute's 2014 Getting to Zero Status report includes an interactive map detailing the net-zero energy buildings that have been verified by NBI.

| Jan 13, 2014
AEC professionals weigh in on school security
An exclusive survey reveals that Building Teams are doing their part to make the nation’s schools safer in the aftermath of the Sandy Hook tragedy.

| Jan 13, 2014
6 legislative actions to ignite the construction economy
The American Institute of Architects announced its “punch list” for Congress that, if completed, will ignite the construction economy by spurring much needed improvements in energy efficiency, infrastructure, and resiliency, and create jobs for small business.

| Jan 12, 2014
The ‘fuzz factor’ in engineering: when continuous improvement is neither
The biggest threat to human life in a building isn’t the potential of natural disasters, but the threat of human error. I believe it’s a reality that increases in probability every time a code or standard change is proposed.
| Jan 12, 2014
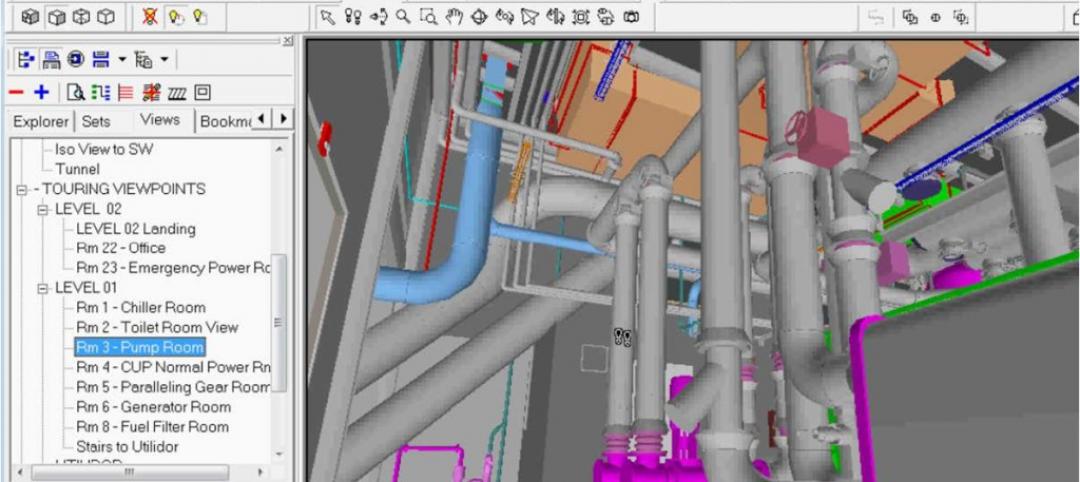
5 ways virtual modeling can improve facilities management
Improved space management, streamlined maintenance, and economical retrofits are among the ways building owners and facility managers can benefit from building information modeling.
| Jan 10, 2014
What the states should do to prevent more school shootings
To tell the truth, I didn’t want to write about the terrible events of December 14, 2012, when 20 children and six adults were gunned down at Sandy Hook Elementary School in Newtown, Conn. I figured other media would provide ample coverage, and anything we did would look cheap or inappropriate. But two things turned me around.

| Jan 10, 2014
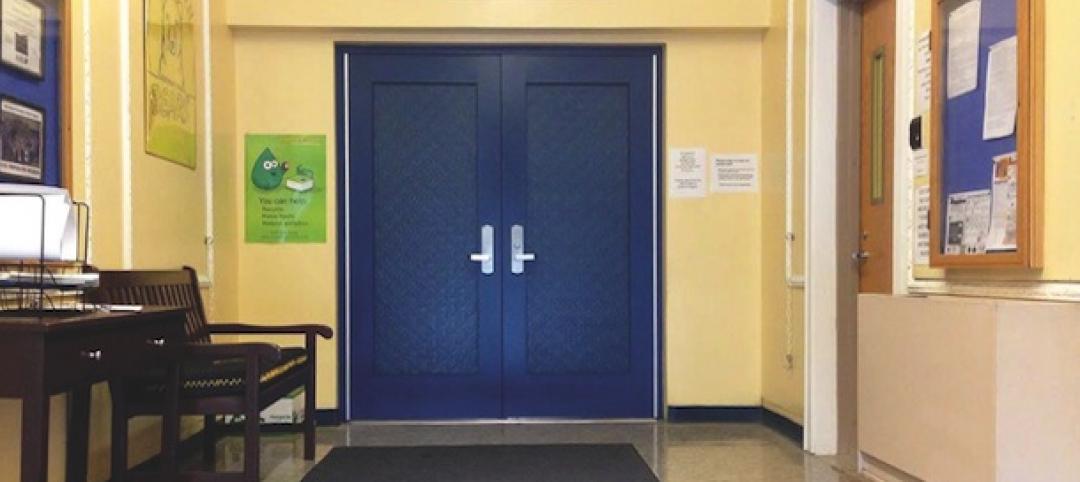
Special Report: K-12 school security in the wake of Sandy Hook
BD+C's exclusive five-part report on K-12 school security offers proven design advice, technology recommendations, and thoughtful commentary on how Building Teams can help school districts prevent, or at least mitigate, a Sandy Hook on their turf.
| Jan 10, 2014
Resiliency, material health among top AEC focuses for 2014: Perkins+Will survey
Architectural giant Perkins+Will recently surveyed its staff of 1,500 design pros to forcast hot trends in the AEC field for 2014. The resulting Design + Insights Survey reflects a global perspective.


