


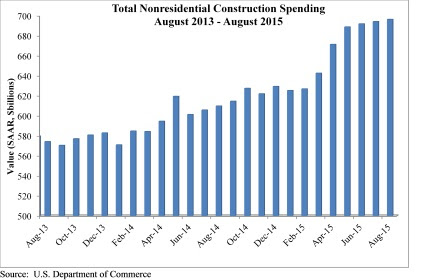
August marked the seventh consecutive month nonresidential construction spending expanded according to an Oct. 1 release supplied by the U.S. Census Bureau. Nonresidential spending totaled $696.3 billion on a seasonally adjusted, annualized basis in August, a 0.3% increase from the previous month and a 12.3% increase from the same time last year. The Census Bureau downwardly revised July's estimate from $696.1 billion to $694.1 billion.
"Job growth is fueling both consumer spending and the absorption of space, all of this is good for construction spending," said Associated Builders and Contractors Chief Economist Anirban Basu. "While construction spending has expanded by more than 12% over the past year, that is not to suggest that macroeconomic risks do not abound. Interest rates are likely to head higher going forward and there is no guarantee that energy prices will remain subdued. While low energy prices have caused some regional economies to slow, investment and spending has been bolstered in others.
"Recently, much attention has been focused on the global economic slowdown and the volatility of financial markets," said Basu. "The Federal Reserve's recent decision not to increase interest rates supported a developing narrative which suggests that the weakness now apparent in much of the world will eventually bring the U.S. into another recession."
Eight of 16 nonresidential construction sectors experienced spending increases in August on a monthly basis:
- Lodging-related construction spending expanded 2.8% on a monthly basis and 41.4% on a year–over-year basis
- Health care-related construction spending grew 1.9% on a monthly basis and 9.1% on a yearly basis
- Public safety-related construction spending expanded 0.4% in August and is 0.2% higher than last year
- Spending in the amusement and recreation category grew 1.3% for the month and 34.7% from the same time last year
- Transportation-related construction spending grew 1.4% in August and is up 12.1% from the same time last year
- Communication-related construction spending is up 0.4% for the month and 11.5% on a yearly basis
- Power-related construction spending expanded 1.2% month-over month but is down 6.7% year-over-year
- Manufacturing-related construction spending expanded 1.3% on a monthly basis and 57.6% on a yearly basis
Spending in half of the nonresidential construction subsectors fell in August on a monthly basis:
- Highway and street-related construction spending fell by 0.6% in August but is up 7% from the same time last year
- Sewage and waste disposal-related construction spending is 0.3% lower from July 2015 but 9% higher than in August 2014
- Water supply-related construction spending is down 0.2% for the month but is up 4.9% over the past 12 months
- Conservation and development-related construction spending fell 0.9% for the month but is up 12.7% from the same time last year
- Office-related construction spending dipped 0.2% lower in August but is up 25.4% since the same time last year
- Spending in the commercial category fell 1.2% for the month but grew 1.3% over the past 12 months
- Educational-related construction spending inched 0.6% lower for the month but is up 5.0% year-over-year
- Religious-related construction spending fell 9.4% for the month and 4.6% from August 2014
To view the previous spending report, click here.
Related Stories

Building Team Awards | May 26, 2016
Cimpress office complex built during historically brutal Massachusetts winter
Lean construction techniques were used to build 275 Wyman Street during a winter that brought more than 100 inches of snow to suburban Boston.

Building Team Awards | May 25, 2016
New health center campus provides affordable care for thousands of Northern Californians
The 38,000-sf, two-level John & Susan Sobrato Campus in Palo Alto is expected to serve 25,000 patients a year by the end of the decade.

Building Team Awards | May 24, 2016
Los Angeles bus depot squeezes the most from a tight site
The Building Team for the MTA Division 13 Bus Operations and Maintenance Facility fit 12 acres’ worth of programming in a multi-level structure on a 4.8-acre site.

Building Team Awards | May 23, 2016
'Greenest ballpark' proves a winner for St. Paul Saints
Solar arrays, a public art courtyard, and a picnic-friendly “park within a park" make the 7,210-seat CHS Field the first ballpark to meet Minnesota sustainable building standards.

Building Team Awards | May 19, 2016
Chinatown library unites and serves two emerging Chicago neighborhoods
The 16,000-sf, pebble-shaped Chinatown Branch Library was built at the intersection of new and old Chinatown neighborhoods. The goal is for the building to unite the communities and serve as a catalyst for the developing area.

Building Team Awards | May 19, 2016
NYC subway station lights the way for 300,000 riders a day
Fulton Center, which handles 85% of the riders coming to Lower Manhattan, is like no other station in the city’s vast underground transit web—and that’s a good thing.

Market Data | May 17, 2016
Modest growth for AIA’s Architecture Billings Index in April
The American Institute of Architects reported the April ABI score was 50.6, down from the mark of 51.9 in the previous month. This score still reflects an increase in design services.

Retail Centers | May 10, 2016
5 factors guiding restaurant design
Restaurants are more than just places to eat. They are comprising town centers and playing into the future of brick-and-mortar retail.

AEC Tech | May 9, 2016
Is the nation’s grand tech boom really an innovation funk?
Despite popular belief, the country is not in a great age of technological and digital innovation, at least when compared to the last great innovation era (1870-1970).

Big Data | May 5, 2016
Demand for data integration technologies for buildings is expected to soar over the next decade
A Navigant Research report takes a deeper dive to examine where demand will be strongest by region and building type.


