


August marked the seventh consecutive month nonresidential construction spending expanded according to an Oct. 1 release supplied by the U.S. Census Bureau. Nonresidential spending totaled $696.3 billion on a seasonally adjusted, annualized basis in August, a 0.3% increase from the previous month and a 12.3% increase from the same time last year. The Census Bureau downwardly revised July's estimate from $696.1 billion to $694.1 billion.
"Job growth is fueling both consumer spending and the absorption of space, all of this is good for construction spending," said Associated Builders and Contractors Chief Economist Anirban Basu. "While construction spending has expanded by more than 12% over the past year, that is not to suggest that macroeconomic risks do not abound. Interest rates are likely to head higher going forward and there is no guarantee that energy prices will remain subdued. While low energy prices have caused some regional economies to slow, investment and spending has been bolstered in others.
"Recently, much attention has been focused on the global economic slowdown and the volatility of financial markets," said Basu. "The Federal Reserve's recent decision not to increase interest rates supported a developing narrative which suggests that the weakness now apparent in much of the world will eventually bring the U.S. into another recession."
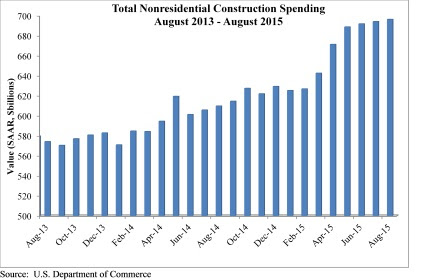
Eight of 16 nonresidential construction sectors experienced spending increases in August on a monthly basis:
- Lodging-related construction spending expanded 2.8% on a monthly basis and 41.4% on a year–over-year basis
- Health care-related construction spending grew 1.9% on a monthly basis and 9.1% on a yearly basis
- Public safety-related construction spending expanded 0.4% in August and is 0.2% higher than last year
- Spending in the amusement and recreation category grew 1.3% for the month and 34.7% from the same time last year
- Transportation-related construction spending grew 1.4% in August and is up 12.1% from the same time last year
- Communication-related construction spending is up 0.4% for the month and 11.5% on a yearly basis
- Power-related construction spending expanded 1.2% month-over month but is down 6.7% year-over-year
- Manufacturing-related construction spending expanded 1.3% on a monthly basis and 57.6% on a yearly basis
Spending in half of the nonresidential construction subsectors fell in August on a monthly basis:
- Highway and street-related construction spending fell by 0.6% in August but is up 7% from the same time last year
- Sewage and waste disposal-related construction spending is 0.3% lower from July 2015 but 9% higher than in August 2014
- Water supply-related construction spending is down 0.2% for the month but is up 4.9% over the past 12 months
- Conservation and development-related construction spending fell 0.9% for the month but is up 12.7% from the same time last year
- Office-related construction spending dipped 0.2% lower in August but is up 25.4% since the same time last year
- Spending in the commercial category fell 1.2% for the month but grew 1.3% over the past 12 months
- Educational-related construction spending inched 0.6% lower for the month but is up 5.0% year-over-year
- Religious-related construction spending fell 9.4% for the month and 4.6% from August 2014
To view the previous spending report, click here.
Related Stories

| Sep 1, 2016
COURTHOUSE GIANTS: A ranking of the nation's top courthouse design and construction firms
DLR Group, NBBJ, Hensel Phelps, Sundt Construction, AECOM, and Dewberry top Building Design+Construction’s annual ranking of the nation’s largest courthouse sector AEC firms, as reported in the 2016 Giants 300 Report.

| Aug 30, 2016
CONVENTION CENTER GIANTS: A ranking of the nation's top convention center sector design and construction firms
Gensler, LMN Architects, AECOM, Turner Construction Co., and WSP | Parsons Brinckerhoff top Building Design+Construction’s annual ranking of the nation’s largest convention center sector AEC firms, as reported in the 2016 Giants 300 Report.

BIM and Information Technology | Aug 30, 2016
BIM GIANTS: A ranking of the nation's top BIM design and construction firms
HOK, Perkins+Will, Turner Construction Co., The Whiting-Turner Contracting Co., Jacobs, and Thornton Tomasetti top Building Design+Construction’s annual ranking of the nation’s largest BIM AEC firms, as reported in the 2016 Giants 300 Report.
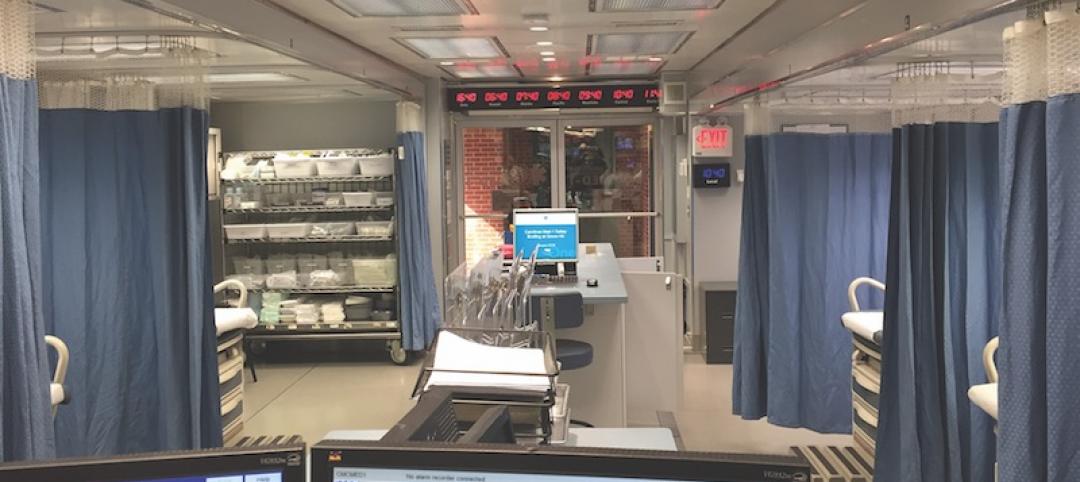
Great Solutions | Aug 23, 2016
11 great solutions for the commercial construction market
A roll-up emergency department, next-gen telemedicine center, and biophilic cooling pods are among the AEC industry’s clever ideas and novel innovations for 2016.

| Aug 19, 2016
RECONSTRUCTION GIANTS: Facelifts give buildings new identities, even as they keep a few wrinkles
Reconstruction is always a balancing act between the client’s pro forma and what the building needs to be vibrant again.

| Aug 19, 2016
Top 110 Reconstruction Construction Firms
Gilbane Building Co., Turner Construction Co., and The Whiting-Turner Contracting Co. top Building Design+Construction’s annual ranking of the nation’s largest reconstruction sector construction and construction management firms, as reported in the 2016 Giants 300 Report.

| Aug 18, 2016
LOCAL GOVERNMENT GIANTS: A ranking of the nation’s top design and construction firms in local sector work
HOK, Stantec, Turner Construction Co.,Clark Group, AECOM and STV top Building Design+Construction’s annual rankings of the nation’s largest local government sector AEC firms, as reported in the 2016 Giants 300 Report.

| Aug 18, 2016
STATE GOVERNMENT GIANTS: A ranking of the nation’s top design and construction firms in state sector work
CannonDesign, Stantec, Turner Construction Co.,Mortensen Construction, WSP | Parsons Brinckerhoff and AECOM top Building Design+Construction’s annual rankings of the nation’s largest state government sector AEC firms, as reported in the 2016 Giants 300 Report.

Hotel Facilities | Aug 17, 2016
First of its kind tri-branded Marriott hotel under construction in downtown Nashville
The hotel will combine the AC Hotels, Residence Inn, and SpringHill Suites brands.
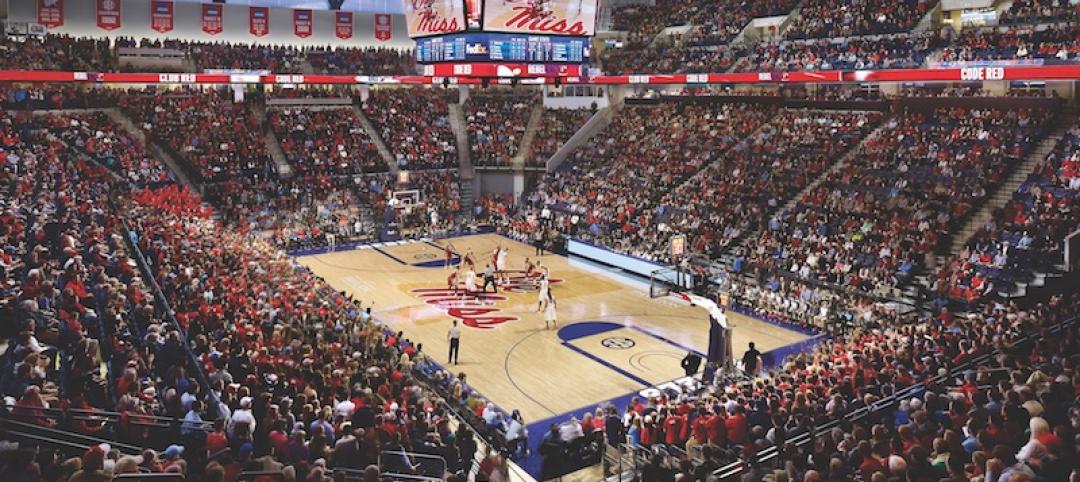
| Aug 15, 2016
SPORTS FACILITY GIANTS: New and renovated college sports venues - designed to serve students and the community
Schools are renovating existing structures or building new sports facilities that can serve the student body and surrounding community.


