


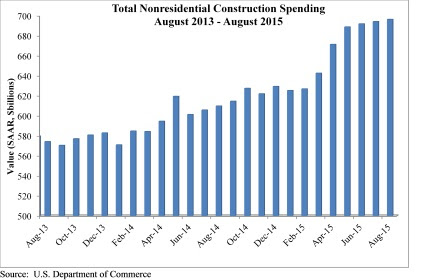
August marked the seventh consecutive month nonresidential construction spending expanded according to an Oct. 1 release supplied by the U.S. Census Bureau. Nonresidential spending totaled $696.3 billion on a seasonally adjusted, annualized basis in August, a 0.3% increase from the previous month and a 12.3% increase from the same time last year. The Census Bureau downwardly revised July's estimate from $696.1 billion to $694.1 billion.
"Job growth is fueling both consumer spending and the absorption of space, all of this is good for construction spending," said Associated Builders and Contractors Chief Economist Anirban Basu. "While construction spending has expanded by more than 12% over the past year, that is not to suggest that macroeconomic risks do not abound. Interest rates are likely to head higher going forward and there is no guarantee that energy prices will remain subdued. While low energy prices have caused some regional economies to slow, investment and spending has been bolstered in others.
"Recently, much attention has been focused on the global economic slowdown and the volatility of financial markets," said Basu. "The Federal Reserve's recent decision not to increase interest rates supported a developing narrative which suggests that the weakness now apparent in much of the world will eventually bring the U.S. into another recession."
Eight of 16 nonresidential construction sectors experienced spending increases in August on a monthly basis:
- Lodging-related construction spending expanded 2.8% on a monthly basis and 41.4% on a year–over-year basis
- Health care-related construction spending grew 1.9% on a monthly basis and 9.1% on a yearly basis
- Public safety-related construction spending expanded 0.4% in August and is 0.2% higher than last year
- Spending in the amusement and recreation category grew 1.3% for the month and 34.7% from the same time last year
- Transportation-related construction spending grew 1.4% in August and is up 12.1% from the same time last year
- Communication-related construction spending is up 0.4% for the month and 11.5% on a yearly basis
- Power-related construction spending expanded 1.2% month-over month but is down 6.7% year-over-year
- Manufacturing-related construction spending expanded 1.3% on a monthly basis and 57.6% on a yearly basis
Spending in half of the nonresidential construction subsectors fell in August on a monthly basis:
- Highway and street-related construction spending fell by 0.6% in August but is up 7% from the same time last year
- Sewage and waste disposal-related construction spending is 0.3% lower from July 2015 but 9% higher than in August 2014
- Water supply-related construction spending is down 0.2% for the month but is up 4.9% over the past 12 months
- Conservation and development-related construction spending fell 0.9% for the month but is up 12.7% from the same time last year
- Office-related construction spending dipped 0.2% lower in August but is up 25.4% since the same time last year
- Spending in the commercial category fell 1.2% for the month but grew 1.3% over the past 12 months
- Educational-related construction spending inched 0.6% lower for the month but is up 5.0% year-over-year
- Religious-related construction spending fell 9.4% for the month and 4.6% from August 2014
To view the previous spending report, click here.
Related Stories

Building Team | Apr 22, 2022
EarthCam Adds Senior Leadership Roles to Facilitate Rapid Growth
EarthCam today announced several new leadership positions as it scales up to accommodate increasing demand for its webcam technology and services.

Architects | Apr 22, 2022
Top 10 green building projects for 2022
The American Institute of Architects' Committee on the Environment (COTE) has announced its COTE Top Ten Awards for significant achievements in advancing climate action.

Mixed-Use | Apr 22, 2022
San Francisco replaces a waterfront parking lot with a new neighborhood
A parking lot on San Francisco’s waterfront is transforming into Mission Rock—a new neighborhood featuring rental units, offices, parks, open spaces, retail, and parking.

Legislation | Apr 21, 2022
NIMBYism in the Sunbelt stymies new apartment development
Population growth in Sunbelt metro areas is driving demand for new apartment development, but resistance is growing against these projects.

Building Team | Apr 20, 2022
White House works with state, local governments to bolster building performance standards
The former head of the U.S. Green Building Council says the Biden Administration’s formation of the National Building Performance Standards Coalition is a “tremendous” step in the right direction to raise building performance standards in the U.S.

Market Data | Apr 20, 2022
Pace of demand for design services rapidly accelerates
Demand for design services in March expanded sharply from February according to a new report today from The American Institute of Architects (AIA).

Multifamily Housing | Apr 20, 2022
A Frankfurt tower gives residents greenery-framed views
In Frankfurt, Germany, the 27-floor EDEN tower boasts an exterior “living wall system”: 186,000 plants that cover about 20 percent of the building’s facade.

AEC Tech | Apr 19, 2022
VDC maturity and the key to driving better, more predictable outcomes
While more stakeholders across the AEC value chain embrace the concept of virtual design and construction, what is driving the vastly different results that organizations achieve? The answer lies within an assessment of VDC maturity.

Healthcare Facilities | Apr 19, 2022
6 trends to watch in healthcare design
As the healthcare landscape continues to evolve, IMEG’s healthcare leaders from across the country are seeing several emerging trends that are poised to have wide-ranging impacts on facility design and construction. Following are six of the trends and strategies they expect to become more commonplace in 2022 and the years to come.

Energy-Efficient Design | Apr 19, 2022
A prefab second skin can make old apartments net zero
A German startup is offering a new way for old buildings to potentially reach net-zero status: adding a prefabricated second skin.


