


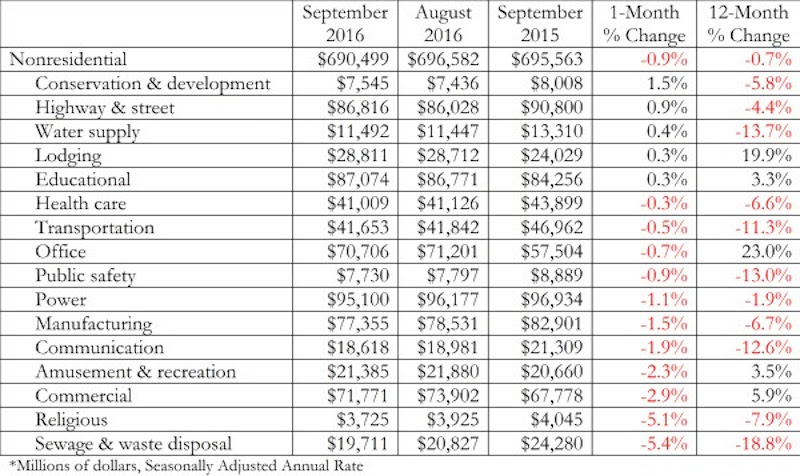
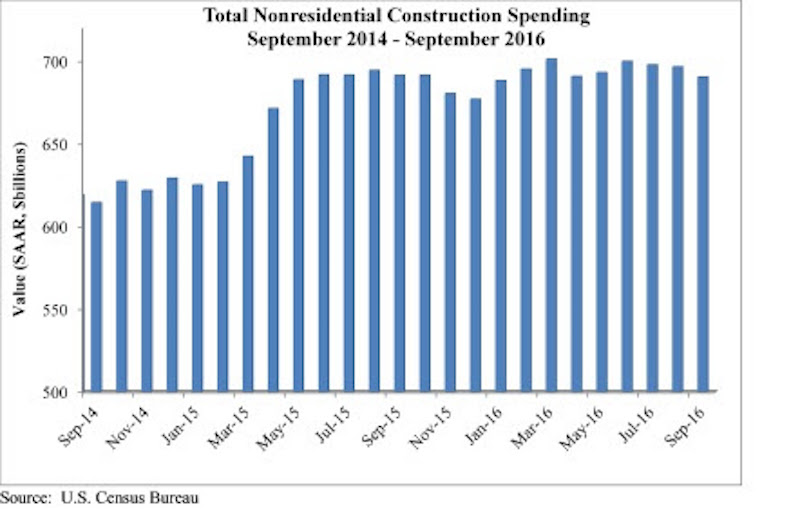
Nonresidential construction spending fell 0.9 percent from August to September 2016, according to analysis of U.S. Census Bureau data released today by Associated Builders and Contractors (ABC). Nonresidential spending totaled $690.5 billion on a seasonally adjusted, annualized basis for the month, 0.7 percent below September 2015’s figure.
The government revised the August nonresidential construction spending estimate from $686.6 billion to $696.6 billion; otherwise September spending would have risen on a month-over-month basis. Eleven of 16 nonresidential construction subsectors experienced monthly declines.
“A number of primarily publicly financed construction segments have experienced declines in spending over the past year, including sewage and waste disposal (-18.8%), water supply (-13.7%), public safety (-13.0%) and transportation (-11.3%). Meanwhile, the level of construction spending in office, lodging and commercial segments is up on a year-over-year basis, though spending in the office and commercial categories was down on a month-over-month basis and lodging-related construction was roughly flat,” says ABC Chief Economist Anirban Basu. “Nonresidential construction spending growth may not accelerate anytime soon, though there is some hope that the period following the elections will usher forth a period of renewed spending growth."
Related Stories

Market Data | Jul 16, 2019
ABC’s Construction Backlog Indicator increases modestly in May
The Construction Backlog Indicator expanded to 8.9 months in May 2019.

K-12 Schools | Jul 15, 2019
Summer assignments: 2019 K-12 school construction costs
Using RSMeans data from Gordian, here are the most recent costs per square foot for K-12 school buildings in 10 cities across the U.S.

Market Data | Jul 12, 2019
Construction input prices plummet in June
This is the first time in nearly three years that input prices have fallen on a year-over-year basis.

Market Data | Jul 1, 2019
Nonresidential construction spending slips modestly in May
Among the 16 nonresidential construction spending categories tracked by the Census Bureau, five experienced increases in monthly spending.

Market Data | Jul 1, 2019
Almost 60% of the U.S. construction project pipeline value is concentrated in 10 major states
With a total of 1,302 projects worth $524.6 billion, California has both the largest number and value of projects in the U.S. construction project pipeline.

Market Data | Jun 21, 2019
Architecture billings remain flat
AIA’s Architecture Billings Index (ABI) score for May showed a small increase in design services at 50.2.

Market Data | Jun 19, 2019
Number of U.S. architects continues to rise
New data from NCARB reveals that the number of architects continues to increase.

Market Data | Jun 12, 2019
Construction input prices see slight increase in May
Among the 11 subcategories, six saw prices fall last month, with the largest decreases in natural gas.

Market Data | Jun 3, 2019
Nonresidential construction spending up 6.4% year over year in April
Among the 16 sectors tracked by the U.S. Census Bureau, nine experienced an increase in monthly spending, led by water supply and highway and street.

Market Data | Jun 3, 2019
4.1% annual growth in office asking rents above five-year compound annual growth rate
Market has experienced no change in office vacancy rates in three quarters.


