


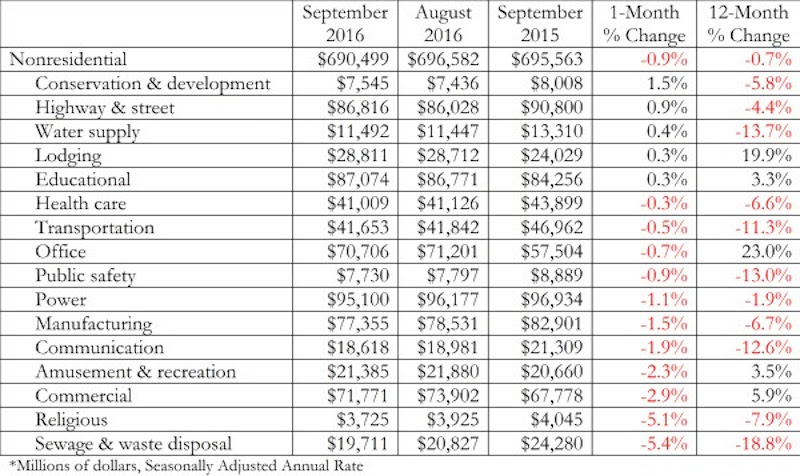
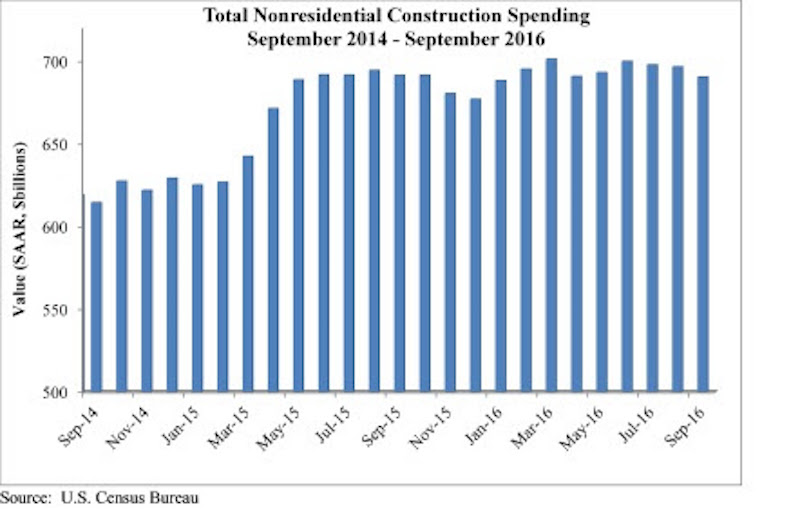
Nonresidential construction spending fell 0.9 percent from August to September 2016, according to analysis of U.S. Census Bureau data released today by Associated Builders and Contractors (ABC). Nonresidential spending totaled $690.5 billion on a seasonally adjusted, annualized basis for the month, 0.7 percent below September 2015’s figure.
The government revised the August nonresidential construction spending estimate from $686.6 billion to $696.6 billion; otherwise September spending would have risen on a month-over-month basis. Eleven of 16 nonresidential construction subsectors experienced monthly declines.
“A number of primarily publicly financed construction segments have experienced declines in spending over the past year, including sewage and waste disposal (-18.8%), water supply (-13.7%), public safety (-13.0%) and transportation (-11.3%). Meanwhile, the level of construction spending in office, lodging and commercial segments is up on a year-over-year basis, though spending in the office and commercial categories was down on a month-over-month basis and lodging-related construction was roughly flat,” says ABC Chief Economist Anirban Basu. “Nonresidential construction spending growth may not accelerate anytime soon, though there is some hope that the period following the elections will usher forth a period of renewed spending growth."
Related Stories

Market Data | Feb 9, 2021
Construction Backlog and contractor optimism rise to start 2021, according to ABC member survey
Despite the monthly uptick, backlog is 0.9 months lower than in January 2020.

Market Data | Feb 9, 2021
USGBC top 10 states for LEED in 2020
The Top 10 States for LEED green building is based on gross square feet of certified space per person using 2010 U.S. Census data and includes commercial and institutional projects certified in 2020.

Market Data | Feb 8, 2021
Construction employment stalls in January with unemployment rate of 9.4%
New measures threaten to undermine recovery.

Market Data | Feb 4, 2021
Construction employment declined in 2020 in majority of metro areas
Houston-The Woodlands-Sugar Land and Brockton-Bridgewater-Easton, Mass. have worst 2020 losses, while Indianapolis-Carmel-Anderson, Ind. and Walla Walla, Wash. register largest gains in industry jobs.

Market Data | Feb 3, 2021
Construction spending diverges in December with slump in private nonresidential sector, mixed public work, and boom in homebuilding
Demand for nonresidential construction and public works will decline amid ongoing pandemic concerns.

Market Data | Feb 1, 2021
The New York City market is back on top and leads the U.S. hotel construction pipeline
New York City has the greatest number of projects under construction with 108 projects/19,439 rooms.

Market Data | Jan 29, 2021
Multifamily housing construction outlook soars in late 2020
Exceeds pre-COVID levels, reaching highest mark since 1st quarter 2018.

Market Data | Jan 29, 2021
The U.S. hotel construction pipeline stands at 5,216 projects/650,222 rooms at year-end 2020
At the end of Q4 ‘20, projects currently under construction stand at 1,487 projects/199,700 rooms.

Multifamily Housing | Jan 27, 2021
2021 multifamily housing outlook: Dallas, Miami, D.C., will lead apartment completions
In its latest outlook report for the multifamily rental market, Yardi Matrix outlined several reasons for hope for a solid recovery for the multifamily housing sector in 2021, especially during the second half of the year.

Market Data | Jan 26, 2021
Construction employment in December trails pre-pandemic levels in 34 states
Texas and Vermont have worst February-December losses while Virginia and Alabama add the most.


