


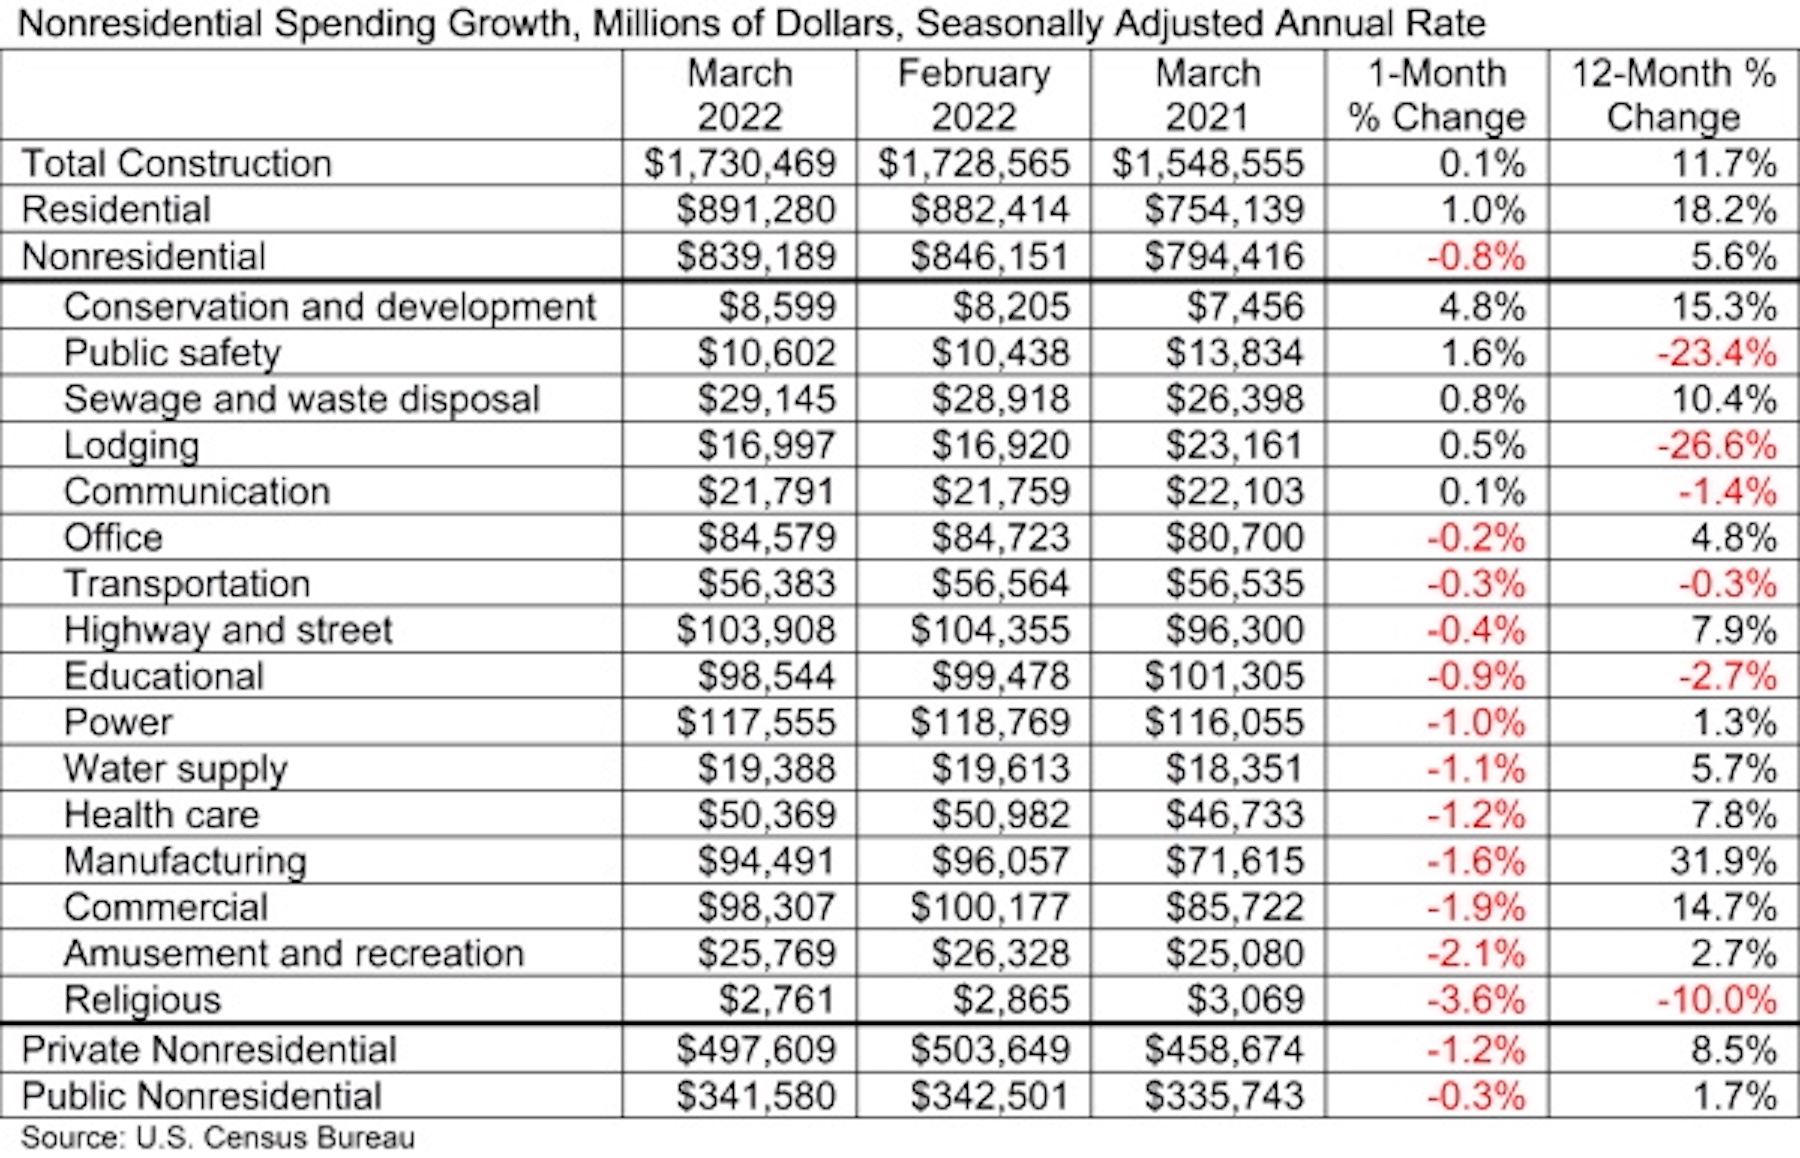
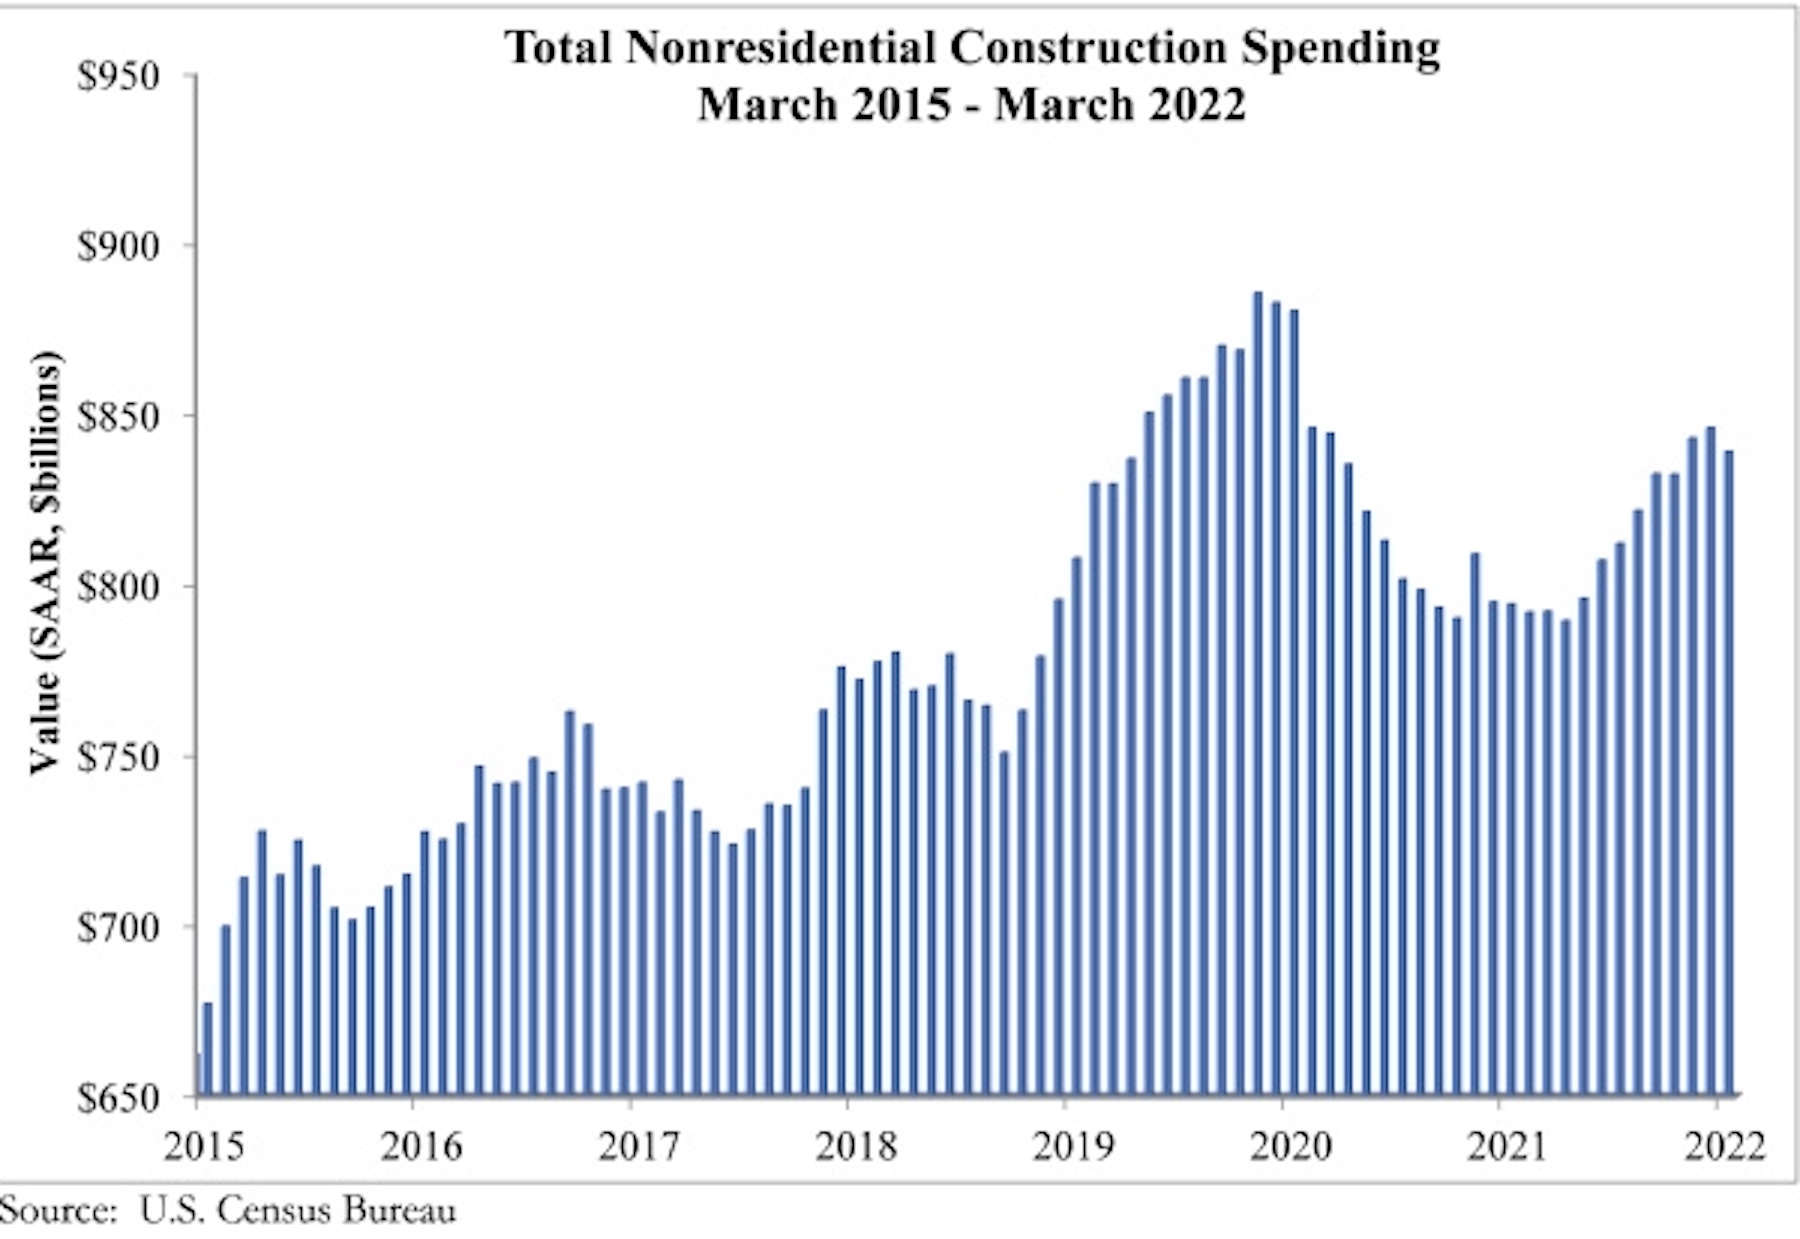
National nonresidential construction spending was down 0.8% in March, according to an Associated Builders and Contractors analysis of data published today by the U.S. Census Bureau. On a seasonally adjusted annualized basis, nonresidential spending totaled $839.2 billion for the month.
Spending was down on a monthly basis in 11 of 16 nonresidential subcategories. Private nonresidential spending was down 1.2%, while public nonresidential construction spending was down 0.3% in March. On a year-over-year basis, nonresidential construction spending is up 5.6%, led by 31.9% growth in construction related to manufacturing.
“March’s construction spending numbers aren’t adjusted for inflation and are actually worse than they look,” said ABC Chief Economist Anirban Basu. “While overall construction spending rose 0.1% in March, largely because of the strength in multifamily residential construction, construction spending was down in real terms. Nonresidential construction performance declined because of weakness in segments like commercial (-1.9%) and amusement/recreation (-2.1%).
“Even though nonresidential construction spending levels are significantly short of what they were pre-pandemic, many contractors indicate that they are operating at capacity, according to ABC’s Construction Backlog Indicator,” said Basu. “This speaks to how challenging the economic environment is becoming, with contractors wrestling with workforce skills shortages and sky-high materials prices. The elevated cost of construction service delivery helps explain why more projects are not moving forward as project owners are forced to wait.
“Circumstances could become easier or more challenging for contractors during the months ahead,” said Basu. “The Federal Reserve’s stepped-up efforts to combat inflation will eventually translate into better pricing for key construction inputs. However, those same efforts will soften the economy. Many economists believe that a recession in America over the next 12 to 18 months has become virtually inevitable. Thus, even as delivering construction services becomes more affordable, demand for construction services, particularly private construction, may begin to fade.”
Related Stories

Market Data | Aug 17, 2021
Demand for design activity continues to expand
The ABI score for July was 54.6.

Market Data | Aug 12, 2021
Steep rise in producer prices for construction materials and services continues in July.
The producer price index for new nonresidential construction rose 4.4% over the past 12 months.

Market Data | Aug 6, 2021
Construction industry adds 11,000 jobs in July
Nonresidential sector trails overall recovery.

Market Data | Aug 2, 2021
Nonresidential construction spending falls again in June
The fall was driven by a big drop in funding for highway and street construction and other public work.

Market Data | Jul 29, 2021
Outlook for construction spending improves with the upturn in the economy
The strongest design sector performers for the remainder of this year are expected to be health care facilities.

Market Data | Jul 29, 2021
Construction employment lags or matches pre-pandemic level in 101 metro areas despite housing boom
Eighty metro areas had lower construction employment in June 2021 than February 2020.

Market Data | Jul 28, 2021
Marriott has the largest construction pipeline of U.S. franchise companies in Q2‘21
472 new hotels with 59,034 rooms opened across the United States during the first half of 2021.

Market Data | Jul 27, 2021
New York leads the U.S. hotel construction pipeline at the close of Q2‘21
Many hotel owners, developers, and management groups have used the operational downtime, caused by COVID-19’s impact on operating performance, as an opportunity to upgrade and renovate their hotels and/or redefine their hotels with a brand conversion.

Market Data | Jul 26, 2021
U.S. construction pipeline continues along the road to recovery
During the first and second quarters of 2021, the U.S. opened 472 new hotels with 59,034 rooms.

Market Data | Jul 21, 2021
Architecture Billings Index robust growth continues
AIA’s Architecture Billings Index (ABI) score for June remained at an elevated level of 57.1.


