


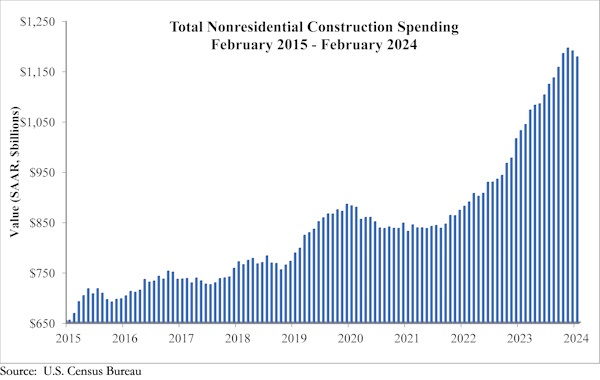
National nonresidential construction spending declined 1.0% in February, according to an Associated Builders and Contractors analysis of data published today by the U.S. Census Bureau. On a seasonally adjusted annualized basis, nonresidential spending totaled $1.179 trillion.
Spending was down in a monthly basis in 15 of the 16 nonresidential subcategories. Private nonresidential spending fell 0.9%, while public nonresidential construction spending was down 1.2% in February.
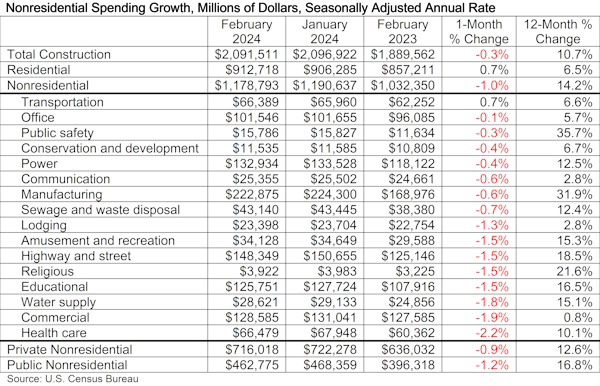
“Virtually every nonresidential construction segment experienced a decline in spending in February,” said ABC Chief Economist Anirban Basu. “In certain instances, the monthly decline was sharp, including health care (-2.2%), commercial (-1.9%) and water supply (-1.8%). The optimist will likely shrug off both the January and February nonresidential construction spending declines as merely reflecting winter weather. The pessimist will proclaim this release a wake-up call to contractors and an indication that higher interest rates have finally begun to make their mark.
“As always, interpreting the data is complicated,” said Basu. “While 15 of 16 nonresidential construction segments recorded monthly declines on a seasonally-adjusted basis, all segments have experienced year-over-year growth in spending. In 10 instances, construction spending has increased more than 10%, including 36% growth in the public safety category and 32% in manufacturing. Moreover, ABC’s Construction Confidence Index indicates that contractors remain confident with respect to their sales over the next six months, signaling that the data could improve with the weather.”
Related Stories

Market Data | May 2, 2017
Nonresidential Spending loses steam after strong start to year
Spending in the segment totaled $708.6 billion on a seasonally adjusted, annualized basis.

Market Data | May 1, 2017
Nonresidential Fixed Investment surges despite sluggish economic in first quarter
Real gross domestic product (GDP) expanded 0.7 percent on a seasonally adjusted annualized rate during the first three months of the year.

Industry Research | Apr 28, 2017
A/E Industry lacks planning, but still spending large on hiring
The average 200-person A/E Firm is spending $200,000 on hiring, and not budgeting at all.

Market Data | Apr 19, 2017
Architecture Billings Index continues to strengthen
Balanced growth results in billings gains in all regions.

Market Data | Apr 13, 2017
2016’s top 10 states for commercial development
Three new states creep into the top 10 while first and second place remain unchanged.

Market Data | Apr 6, 2017
Architecture marketing: 5 tools to measure success
We’ve identified five architecture marketing tools that will help your firm evaluate if it’s on the track to more leads, higher growth, and broader brand visibility.

Market Data | Apr 3, 2017
Public nonresidential construction spending rebounds; overall spending unchanged in February
The segment totaled $701.9 billion on a seasonally adjusted annualized rate for the month, marking the seventh consecutive month in which nonresidential spending sat above the $700 billion threshold.

Market Data | Mar 29, 2017
Contractor confidence ends 2016 down but still in positive territory
Although all three diffusion indices in the survey fell by more than five points they remain well above the threshold of 50, which signals that construction activity will continue to be one of the few significant drivers of economic growth.

Market Data | Mar 24, 2017
These are the most and least innovative states for 2017
Connecticut, Virginia, and Maryland are all in the top 10 most innovative states, but none of them were able to claim the number one spot.

Market Data | Mar 22, 2017
After a strong year, construction industry anxious about Washington’s proposed policy shifts
Impacts on labor and materials costs at issue, according to latest JLL report.


