


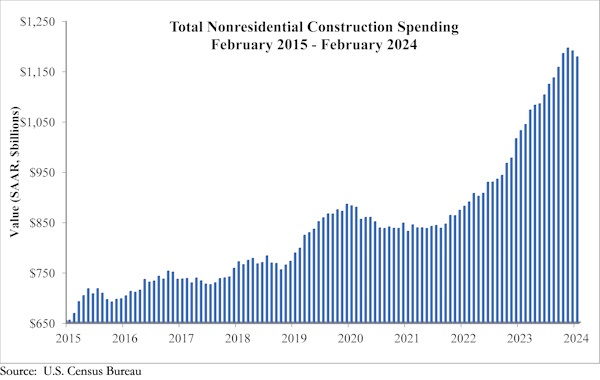
National nonresidential construction spending declined 1.0% in February, according to an Associated Builders and Contractors analysis of data published today by the U.S. Census Bureau. On a seasonally adjusted annualized basis, nonresidential spending totaled $1.179 trillion.
Spending was down in a monthly basis in 15 of the 16 nonresidential subcategories. Private nonresidential spending fell 0.9%, while public nonresidential construction spending was down 1.2% in February.
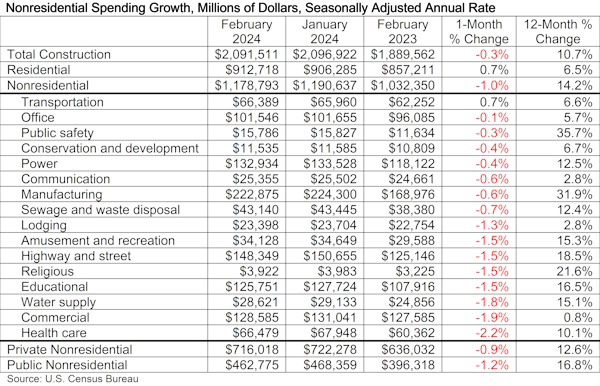
“Virtually every nonresidential construction segment experienced a decline in spending in February,” said ABC Chief Economist Anirban Basu. “In certain instances, the monthly decline was sharp, including health care (-2.2%), commercial (-1.9%) and water supply (-1.8%). The optimist will likely shrug off both the January and February nonresidential construction spending declines as merely reflecting winter weather. The pessimist will proclaim this release a wake-up call to contractors and an indication that higher interest rates have finally begun to make their mark.
“As always, interpreting the data is complicated,” said Basu. “While 15 of 16 nonresidential construction segments recorded monthly declines on a seasonally-adjusted basis, all segments have experienced year-over-year growth in spending. In 10 instances, construction spending has increased more than 10%, including 36% growth in the public safety category and 32% in manufacturing. Moreover, ABC’s Construction Confidence Index indicates that contractors remain confident with respect to their sales over the next six months, signaling that the data could improve with the weather.”
Related Stories

Market Data | Jul 16, 2019
ABC’s Construction Backlog Indicator increases modestly in May
The Construction Backlog Indicator expanded to 8.9 months in May 2019.

K-12 Schools | Jul 15, 2019
Summer assignments: 2019 K-12 school construction costs
Using RSMeans data from Gordian, here are the most recent costs per square foot for K-12 school buildings in 10 cities across the U.S.

Market Data | Jul 12, 2019
Construction input prices plummet in June
This is the first time in nearly three years that input prices have fallen on a year-over-year basis.

Market Data | Jul 1, 2019
Nonresidential construction spending slips modestly in May
Among the 16 nonresidential construction spending categories tracked by the Census Bureau, five experienced increases in monthly spending.

Market Data | Jul 1, 2019
Almost 60% of the U.S. construction project pipeline value is concentrated in 10 major states
With a total of 1,302 projects worth $524.6 billion, California has both the largest number and value of projects in the U.S. construction project pipeline.

Market Data | Jun 21, 2019
Architecture billings remain flat
AIA’s Architecture Billings Index (ABI) score for May showed a small increase in design services at 50.2.

Market Data | Jun 19, 2019
Number of U.S. architects continues to rise
New data from NCARB reveals that the number of architects continues to increase.

Market Data | Jun 12, 2019
Construction input prices see slight increase in May
Among the 11 subcategories, six saw prices fall last month, with the largest decreases in natural gas.

Market Data | Jun 3, 2019
Nonresidential construction spending up 6.4% year over year in April
Among the 16 sectors tracked by the U.S. Census Bureau, nine experienced an increase in monthly spending, led by water supply and highway and street.

Market Data | Jun 3, 2019
4.1% annual growth in office asking rents above five-year compound annual growth rate
Market has experienced no change in office vacancy rates in three quarters.


