


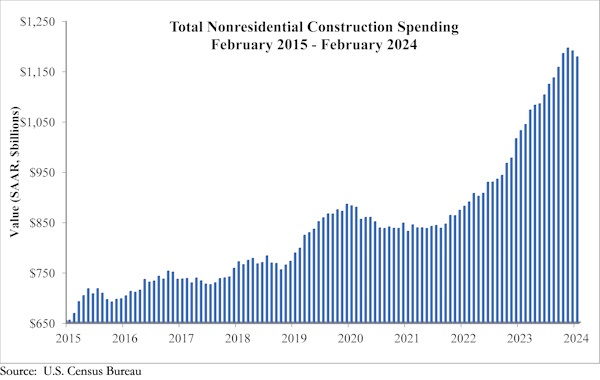
National nonresidential construction spending declined 1.0% in February, according to an Associated Builders and Contractors analysis of data published today by the U.S. Census Bureau. On a seasonally adjusted annualized basis, nonresidential spending totaled $1.179 trillion.
Spending was down in a monthly basis in 15 of the 16 nonresidential subcategories. Private nonresidential spending fell 0.9%, while public nonresidential construction spending was down 1.2% in February.
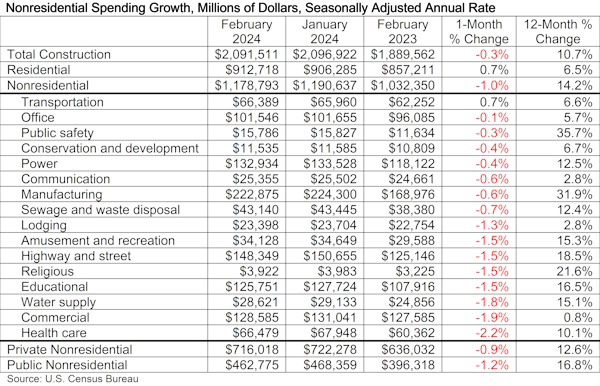
“Virtually every nonresidential construction segment experienced a decline in spending in February,” said ABC Chief Economist Anirban Basu. “In certain instances, the monthly decline was sharp, including health care (-2.2%), commercial (-1.9%) and water supply (-1.8%). The optimist will likely shrug off both the January and February nonresidential construction spending declines as merely reflecting winter weather. The pessimist will proclaim this release a wake-up call to contractors and an indication that higher interest rates have finally begun to make their mark.
“As always, interpreting the data is complicated,” said Basu. “While 15 of 16 nonresidential construction segments recorded monthly declines on a seasonally-adjusted basis, all segments have experienced year-over-year growth in spending. In 10 instances, construction spending has increased more than 10%, including 36% growth in the public safety category and 32% in manufacturing. Moreover, ABC’s Construction Confidence Index indicates that contractors remain confident with respect to their sales over the next six months, signaling that the data could improve with the weather.”
Related Stories

Market Data | Jan 24, 2022
U.S. hotel construction pipeline stands at 4,814 projects/581,953 rooms at year-end 2021
Projects scheduled to start construction in the next 12 months stand at 1,821 projects/210,890 rooms at the end of the fourth quarter.

Market Data | Jan 19, 2022
Architecture firms end 2021 on a strong note
December’s Architectural Billings Index (ABI) score of 52.0 was an increase from 51.0 in November.

Market Data | Jan 13, 2022
Materials prices soar 20% in 2021 despite moderating in December
Most contractors in association survey list costs as top concern in 2022.

Market Data | Jan 12, 2022
Construction firms forsee growing demand for most types of projects
Seventy-four percent of firms plan to hire in 2022 despite supply-chain and labor challenges.

Market Data | Jan 7, 2022
Construction adds 22,000 jobs in December
Jobless rate falls to 5% as ongoing nonresidential recovery offsets rare dip in residential total.

Market Data | Jan 6, 2022
Inflation tempers optimism about construction in North America
Rider Levett Bucknall’s latest report cites labor shortages and supply chain snags among causes for cost increases.

Market Data | Jan 6, 2022
A new survey offers a snapshot of New York’s construction market
Anchin’s poll of 20 AEC clients finds a “growing optimism,” but also multiple pressure points.

Market Data | Jan 3, 2022
Construction spending in November increases from October and year ago
Construction spending in November totaled $1.63 trillion at a seasonally adjusted annual rate.

Market Data | Dec 22, 2021
Two out of three metro areas add construction jobs from November 2020 to November 2021
Construction employment increased in 237 or 66% of 358 metro areas over the last 12 months.

Market Data | Dec 17, 2021
Construction jobs exceed pre-pandemic level in 18 states and D.C.
Firms struggle to find qualified workers to keep up with demand.


