


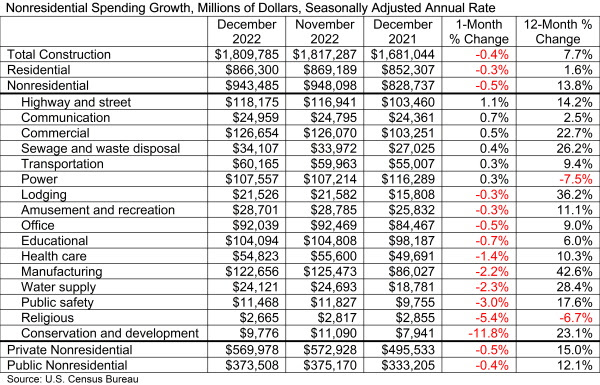
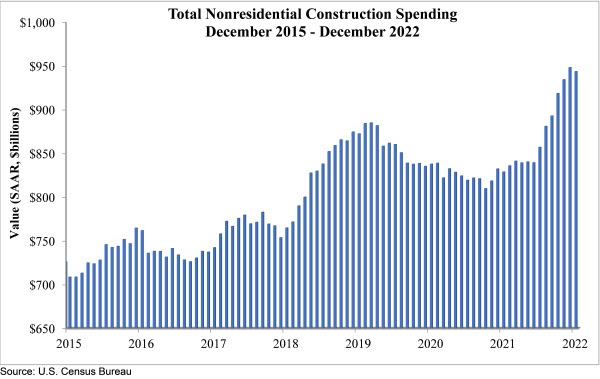
National nonresidential construction spending decreased by 0.5% in December, according to an Associated Builders and Contractors analysis of data published today by the U.S. Census Bureau. On a seasonally adjusted annualized basis, nonresidential spending totaled $943.5 billion for the month.
Spending fell on a monthly basis in 10 of the 16 nonresidential subcategories. Private nonresidential spending was down 0.5%, while public nonresidential construction spending was down 0.4% in December.
“Nonresidential construction spending fell in December, ending a streak of six straight monthly increases,” said ABC Chief Economist Anirban Basu. “Despite the decline, nonresidential spending is up 13.8% year over year, an increase outpacing both overall inflation (6.4%) and materials prices inflation (+7.6%). More than half of the increase in nonresidential construction over the past year is due to heightened activity in two segments: manufacturing, as megaprojects begin across the nation, and commercial, a category that includes warehouse- and distribution-related construction.
“While contractors remain reasonably confident, according to ABC’s Construction Confidence Index, there is reason for caution,” said Basu. “Worker shortages remain a challenge for contractors, and elevated interest rates have increased borrowing costs, making certain projects unfeasible at the margins while also driving the economy toward a potential recession this year.”
Related Stories

Market Data | Jun 22, 2018
Multifamily market remains healthy – Can it be sustained?
New report says strong economic fundamentals outweigh headwinds.

Market Data | Jun 21, 2018
Architecture firm billings strengthen in May
Architecture Billings Index enters eighth straight month of solid growth.

Market Data | Jun 20, 2018
7% year-over-year growth in the global construction pipeline
There are 5,952 projects/1,115,288 rooms under construction, up 8% by projects YOY.

Market Data | Jun 19, 2018
ABC’s Construction Backlog Indicator remains elevated in first quarter of 2018
The CBI shows highlights by region, industry, and company size.

Market Data | Jun 19, 2018
America’s housing market still falls short of providing affordable shelter to many
The latest report from the Joint Center for Housing Studies laments the paucity of subsidies to relieve cost burdens of ownership and renting.

Market Data | Jun 18, 2018
AI is the path to maximum profitability for retail and FMCG firms
Leading retailers including Amazon, Alibaba, Lowe’s and Tesco are developing their own AI solutions for automation, analytics and robotics use cases.

Market Data | Jun 12, 2018
Yardi Matrix report details industrial sector's strength
E-commerce and biopharmaceutical companies seeking space stoke record performances across key indicators.

Market Data | Jun 8, 2018
Dodge Momentum Index inches up in May
May’s gain was the result of a 4.7% increase by the commercial component of the Momentum Index.

Market Data | Jun 4, 2018
Nonresidential construction remains unchanged in April
Private sector spending increased 0.8% on a monthly basis and is up 5.3% from a year ago.

Market Data | May 30, 2018
Construction employment increases in 256 metro areas between April 2017 & 2018
Dallas-Plano-Irving and Midland, Texas experience largest year-over-year gains; St. Louis, Mo.-Ill. and Bloomington, Ill. have biggest annual declines in construction employment amid continuing demand.


