


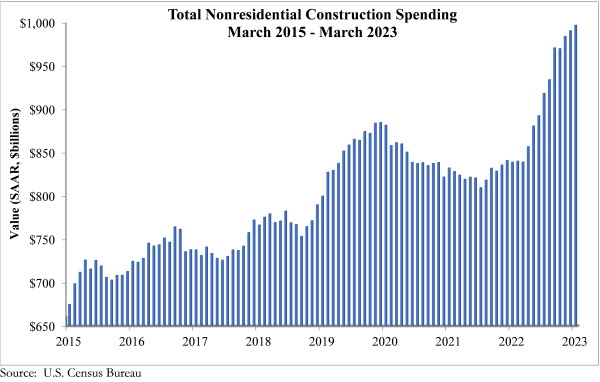
National nonresidential construction spending increased by 0.7% in March, according to an Associated Builders and Contractors analysis of data published today by the U.S. Census Bureau. On a seasonally adjusted annualized basis, nonresidential spending totaled $997.1 billion for the month.
Spending increased on a monthly basis in 8 of the 16 nonresidential subcategories. Private nonresidential spending rose 1.0%, while public nonresidential construction spending increased 0.2% in March.
“Nonresidential construction spending increased for the 10th time in the past 11 months,” said ABC Chief Economist Anirban Basu. “As has been the case for the past several months, though, the expansion in nonresidential investment is attributable to manufacturing. Were it not for a 4.6% increase in manufacturing-related spending, the nonresidential category would have been flat in March. Because this data is not adjusted for inflation, real nonresidential construction spending excluding manufacturing actually contracted in March."
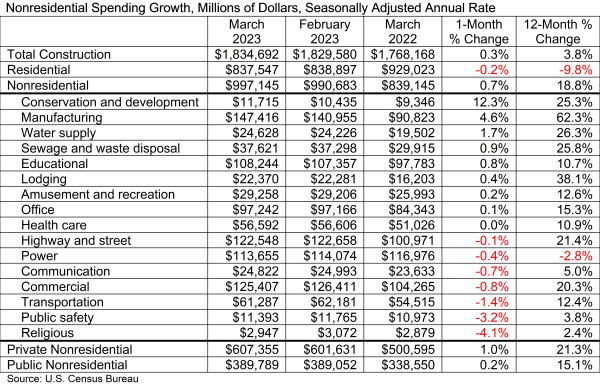
“Contractors remain optimistic about their sales and profit margins over the next six months, according to ABC’s Construction Confidence Index,” said Basu. “Given the surprising resilience of construction activity in the face of ongoing interest rate increases and pervasive fears of recession, this confidence has proved justified. Spending has increased over the past year in every nonresidential subsector except for the power category, and multifamily construction is up 23.0% over the past year. The only construction category that is meaningfully affected by interest rate increases is single-family construction; spending is down 22.9% since March 2022.”
Related Stories

Market Data | Jan 30, 2018
AIA Consensus Forecast: 4.0% growth for nonresidential construction spending in 2018
The commercial office and retail sectors will lead the way in 2018, with a strong bounce back for education and healthcare.

Market Data | Jan 29, 2018
Year-end data show economy expanded in 2017; Fixed investment surged in fourth quarter
The economy expanded at an annual rate of 2.6% during the fourth quarter of 2017.

Market Data | Jan 25, 2018
Renters are the majority in 42 U.S. cities
Over the past 10 years, the number of renters has increased by 23 million.

Market Data | Jan 24, 2018
HomeUnion names the most and least affordable rental housing markets
Chicago tops the list as the most affordable U.S. metro, while Oakland, Calif., is the most expensive rental market.

Market Data | Jan 12, 2018
Construction input prices inch down in December, Up YOY despite low inflation
Energy prices have been more volatile lately.

Market Data | Jan 4, 2018
Nonresidential construction spending ticks higher in November, down year-over-year
Despite the month-over-month expansion, nonresidential spending fell 1.3 percent from November 2016.

Contractors | Jan 4, 2018
Construction spending in a ‘mature’ period of incremental growth
Labor shortages are spiking wages. Materials costs are rising, too.
 reported the November ABI score was 55.0, up from a score of 51.7 in the previous month. Photo: Pixabay")
Market Data | Dec 20, 2017
Architecture billings upturn shows broad strength
The American Institute of Architects (AIA) reported the November ABI score was 55.0, up from a score of 51.7 in the previous month.

Market Data | Dec 14, 2017
ABC chief economist predicts stable 2018 construction economy
There are risks to the 2018 outlook as a number of potential cost increases could come into play.

Market Data | Dec 13, 2017
Top world regions and markets in the global hotel construction pipeline
The top world region by project count is North America.


