


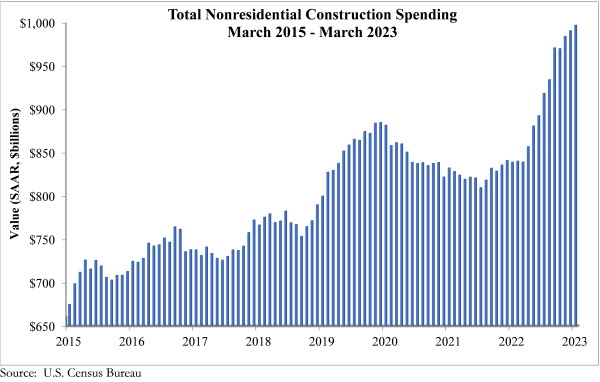
National nonresidential construction spending increased by 0.7% in March, according to an Associated Builders and Contractors analysis of data published today by the U.S. Census Bureau. On a seasonally adjusted annualized basis, nonresidential spending totaled $997.1 billion for the month.
Spending increased on a monthly basis in 8 of the 16 nonresidential subcategories. Private nonresidential spending rose 1.0%, while public nonresidential construction spending increased 0.2% in March.
“Nonresidential construction spending increased for the 10th time in the past 11 months,” said ABC Chief Economist Anirban Basu. “As has been the case for the past several months, though, the expansion in nonresidential investment is attributable to manufacturing. Were it not for a 4.6% increase in manufacturing-related spending, the nonresidential category would have been flat in March. Because this data is not adjusted for inflation, real nonresidential construction spending excluding manufacturing actually contracted in March."
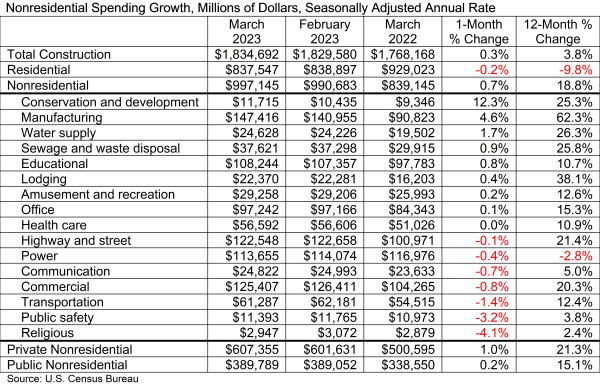
“Contractors remain optimistic about their sales and profit margins over the next six months, according to ABC’s Construction Confidence Index,” said Basu. “Given the surprising resilience of construction activity in the face of ongoing interest rate increases and pervasive fears of recession, this confidence has proved justified. Spending has increased over the past year in every nonresidential subsector except for the power category, and multifamily construction is up 23.0% over the past year. The only construction category that is meaningfully affected by interest rate increases is single-family construction; spending is down 22.9% since March 2022.”
Related Stories

Market Data | Mar 22, 2019
Construction contractors regain confidence in January 2019
Expectations for sales during the coming six-month period remained especially upbeat in January.

Market Data | Mar 21, 2019
Billings moderate in February following robust New Year
AIA’s Architecture Billings Index (ABI) score for February was 50.3, down from 55.3 in January.

Market Data | Mar 19, 2019
ABC’s Construction Backlog Indicator declines sharply in January 2019
The Construction Backlog Indicator contracted to 8.1 months during January 2019.

Market Data | Mar 15, 2019
2019 starts off with expansion in nonresidential spending
At a seasonally adjusted annualized rate, nonresidential spending totaled $762.5 billion for the month.

Market Data | Mar 14, 2019
Construction input prices rise for first time since October
Of the 11 construction subcategories, seven experienced price declines for the month.

Market Data | Mar 6, 2019
Global hotel construction pipeline hits record high at 2018 year-end
There are a record-high 6,352 hotel projects and 1.17 million rooms currently under construction worldwide.

Market Data | Feb 28, 2019
U.S. economic growth softens in final quarter of 2018
Year-over-year GDP growth was 3.1%, while average growth for 2018 was 2.9%.

Market Data | Feb 20, 2019
Strong start to 2019 for architecture billings
“The government shutdown affected architecture firms, but doesn’t appear to have created a slowdown in the profession,” said AIA Chief Economist Kermit Baker, Hon. AIA, PhD, in the latest ABI report.

Market Data | Feb 19, 2019
ABC Construction Backlog Indicator steady in Q4 2018
CBI reached a record high of 9.9 months in the second quarter of 2018 and averaged about 9.1 months throughout all four quarters of last year.

Market Data | Feb 14, 2019
U.S. Green Building Council announces top 10 countries and regions for LEED green building
The list ranks countries and regions in terms of cumulative LEED-certified gross square meters as of December 31, 2018.


