


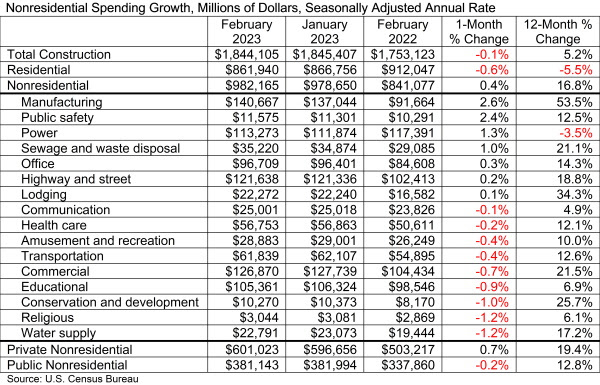
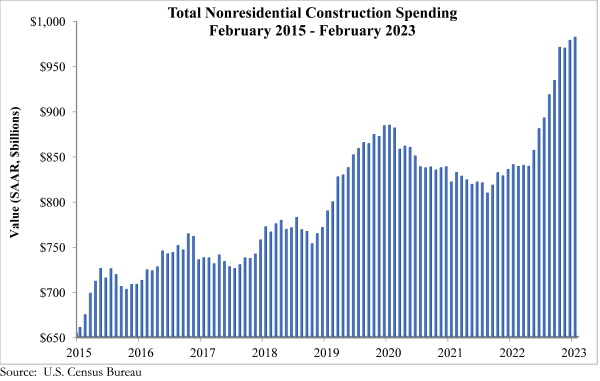
National nonresidential construction spending increased 0.4% in February, according to an Associated Builders and Contractors analysis of data published by the U.S. Census Bureau. On a seasonally adjusted annualized basis, nonresidential spending totaled $982.2 billion for the month, up 16.8% from the previous year.
Spending declined on a monthly basis in nine of the 16 nonresidential subcategories. Private nonresidential spending was up 0.7%, while public nonresidential construction spending was down 0.2% in February.
“Nonresidential construction spending increased for the eighth time in the past nine months in February,” said ABC Chief Economist Anirban Basu. “Importantly, almost all of the nonresidential sector’s momentum is attributable to manufacturing-related construction, which accounted for nearly 35% of the year-over-year growth in spending. Excluding the manufacturing segment, spending in the other 15 nonresidential segments collectively declined in February.
“While the manufacturing segment should continue to see elevated levels of investment, tightening credit conditions will likely hinder nonresidential construction momentum in the near term,” said Basu. “Contractors maintain a healthy level of backlog, according to ABC’s Construction Backlog Indicator, but a gloomy economic outlook and difficulty securing financing are potential headwinds for the industry for the rest of 2023.”
Related Stories

Codes and Standards | Mar 1, 2022
Engineering Business Sentiment study finds optimism despite growing economic concerns
The ACEC Research Institute found widespread optimism among engineering firm executives in its second quarterly Engineering Business Sentiment study.

Codes and Standards | Feb 24, 2022
Most owners adapting digital workflows on projects
Owners are more deeply engaged with digital workflows than other project team members, according to a new report released by Trimble and Dodge Data & Analytics.

Market Data | Feb 23, 2022
2022 Architecture Billings Index indicates growth
The Architectural Billings Index measures the general sentiment of U.S. architecture firms about the health of the construction market by measuring 1) design billings and 2) design contracts. Any score above 50 means that, among the architecture firms surveyed, more firms than not reported seeing increases in design work vs. the previous month.

Market Data | Feb 15, 2022
Materials prices soar 20% between January 2021 and January 2022
Contractors' bid prices accelerate but continue to lag cost increases.

Market Data | Feb 4, 2022
Construction employment dips in January despite record rise in wages, falling unemployment
The quest for workers intensifies among industries.

Market Data | Feb 2, 2022
Majority of metro areas added construction jobs in 2021
Soaring job openings indicate that labor shortages are only getting worse.

Market Data | Feb 2, 2022
Construction spending increased in December for the month and the year
Nonresidential and public construction lagged residential sector.

Market Data | Jan 31, 2022
Canada's hotel construction pipeline ends 2021 with 262 projects and 35,325 rooms
At the close of 2021, projects under construction stand at 62 projects/8,100 rooms.

Market Data | Jan 27, 2022
Record high counts for franchise companies in the early planning stage at the end of Q4'21
Through year-end 2021, Marriott, Hilton, and IHG branded hotels represented 585 new hotel openings with 73,415 rooms.

Market Data | Jan 27, 2022
Dallas leads as the top market by project count in the U.S. hotel construction pipeline at year-end 2021
The market with the greatest number of projects already in the ground, at the end of the fourth quarter, is New York with 90 projects/14,513 rooms.


