

From July through October of 2020, national construction costs rose, on average, by 0.25%, based on 14 markets in North America tracked by the construction consulting firm Rider Levett Bucknall (RLB), which has just released its North America Construction Cost report for the fourth quarter of 2020.
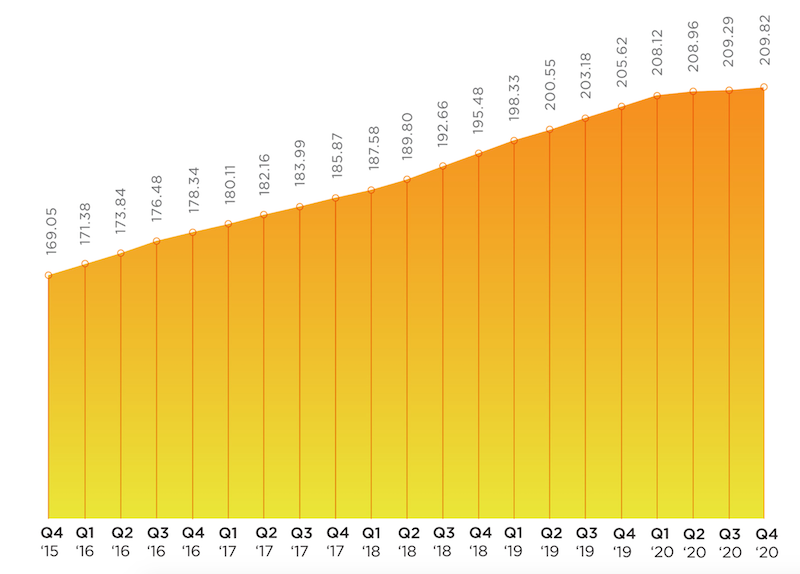
Over the first 10 months of last year, construction spending rose by 3.7% to $1.439 trillion, according to Census Bureau estimates. Construction costs were up by 2.03%. RLB’s National Construction Cost Index stood at 209.82 for the fourth quarter of last year, compared to 205.62 for the same period a year earlier. After rising consistently since the fourth quarter of 2015, RLB’s Index tapered off last year.
The full report can be downloaded from here.
Given the impact of construction activity from the coronavirus pandemic, “the economic damage incurred over the past nine months will take time to heal,” writes Julian Anderson, FRICS, President-North America for RLB.
Anderson expresses concern about lingering unemployment that is “casting a darker shadow over the economy.” He speaks optimistically about President-Elect Joe Biden’s expansive infrastructure plan, whose passage became more likely now that Democrats will control the executive and legislative branches following the election of two Democratic senators in Georgia earlier this month.

For the most part, inflation is under control in the construction sectors of U.S. metros.
Anderson predicts that Biden’s plan will receive bipartisan support “if it is tied to creating jobs that have been lost due to the pandemic.” The New York Times, quoting Bureau of Labor Statistics estimates, reported on January 9 that 9.4 million jobs were lost in the U.S. in 2020, the worst year since World War II.
Construction unemployment, which spiked in the second quarter when the coronavirus delayed or postponed projects, has recovered of late. The industry gained 51,00 jobs in December, even though the total for the year was down 142,000, or 1.9%. However, a survey that included 1,329 responses, conducted by Associated General Contractors of America (AGC) in every state from Nov. 11 through Dec. 11, found that contractors are generally pessimistic about the outlook for nonresidential and multifamily construction in 2021.
SAN FRANCISCO STILL COSTLIEST MARKET
RLB’s report breaks down its Cost Index by cities and building types. For example, San Francisco, New York, and Boston registered the highest indices for prime office construction. Chicago, Honolulu, and San Francisco had the highest cost indices for five-star hotels. Los Angeles is the most expensive market in which to build hospitals, in part because of California’s seismic mitigation requirements.

This chart shows the relative costs of materials and labor as bid in markets around the U.S., and the average percentage change from October 2019 to October 2020.
San Francisco and Los Angeles had the highest indices for the Industrial sector, Sn Francisco and Seattle for multifamily costs, and Honolulu and New York for costs attendant to building high schools.
All told, Chicago, Boston, New York, Portland, and San Francisco all experienced cost increases that were higher than the national average in the latest quarter, even though Chicago’s Cost Index was lower, by 1.29%, for the year. Conversely, Los Angeles experienced the highest October 2019-October 2020 increase in its Cost Index, 4.41%, despite a slight decline in the latest quarter. And for the year, San Francisco had the highest “as bid” index measuring a representative sampling of materials and labor among the markets tracked.
Denver, Seattle, and Washington D.C. saw quarterly increases that were below the national average for construction costs.
Related Stories

Market Data | Jul 8, 2021
Encouraging construction cost trends are emerging
In its latest quarterly report, Rider Levett Bucknall states that contractors’ most critical choice will be selecting which building sectors to target.

Multifamily Housing | Jul 7, 2021
Make sure to get your multifamily amenities mix right
One of the hardest decisions multifamily developers and their design teams have to make is what mix of amenities they’re going to put into each project. A lot of squiggly factors go into that decision: the type of community, the geographic market, local recreation preferences, climate/weather conditions, physical parameters, and of course the budget. The permutations are mind-boggling.

Market Data | Jul 7, 2021
Construction employment declines by 7,000 in June
Nonresidential firms struggle to find workers and materials to complete projects.

Market Data | Jun 30, 2021
Construction employment in May trails pre-covid levels in 91 metro areas
Firms struggle to cope with materials, labor challenges.

Market Data | Jun 23, 2021
Construction employment declines in 40 states between April and May
Soaring material costs, supply-chain disruptions impede recovery.

Market Data | Jun 22, 2021
Architecture billings continue historic rebound
AIA’s Architecture Billings Index (ABI) score for May rose to 58.5 compared to 57.9 in April.

Market Data | Jun 17, 2021
Commercial construction contractors upbeat on outlook despite worsening material shortages, worker shortages
88% indicate difficulty in finding skilled workers; of those, 35% have turned down work because of it.

Market Data | Jun 16, 2021
Construction input prices rise 4.6% in May; softwood lumber prices up 154% from a year ago
Construction input prices are 24.3% higher than a year ago, while nonresidential construction input prices increased 23.9% over that span.

Market Data | Jun 16, 2021
Producer prices for construction materials and services jump 24% over 12 months
The 24.3% increase in prices for materials used in construction from May 2020 to last month was nearly twice as great as in any previous year

Market Data | Jun 15, 2021
ABC’s Construction Backlog inches higher in May
Materials and labor shortages suppress contractor confidence.


