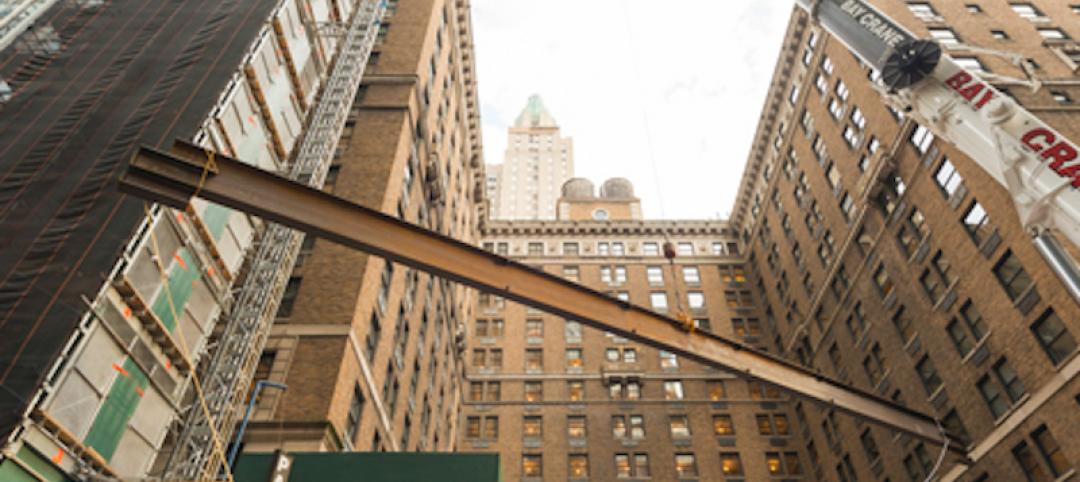
In the recent U.S. Construction Pipeline Trend Report released by Lodging Econometrics (LE), at the close of Q1‘21, New York City continues to hold the lead amongst U.S. markets for the most projects in the U.S. construction pipeline with 145 projects/24,762 rooms. Other U.S. markets that follow are Los Angeles with 144 projects/23,994 rooms, Dallas with 135 projects/16,260 rooms, Atlanta with 132 projects/18,264 rooms, and Orlando with 98 projects/17,536 rooms.
New York City has the greatest number of projects under construction with 110 projects/19,457 rooms. Following New York City with the highest number of projects under construction is Los Angeles with 39 projects/6,657 rooms, and then Atlanta with 39 projects/5,500 rooms, Dallas with 32 projects/3,795 rooms, and Orlando with 27 projects/4,693 rooms.
The top 50 markets in the U.S. announced a total of 74 new projects, accounting for 10,219 rooms, during Q1 ’21. The leading markets for new project announcements include Riverside-San Bernardino, CA with 6 projects/633 rooms, Los Angeles with 5 projects accounting for 768 rooms, Phoenix with 5 projects/402 rooms, Nashville with 4 projects/692 rooms, and San Diego with 4 projects/474 rooms. New project announcements have been slow in the wake of the pandemic, due in part to the inability to conduct business in the traditional pre-COVID way, but developers are increasingly optimistic and anxious to move forward with new projects as the country fully reopens.
Experts at LE are seeing an increase in renovation and brand conversion activity throughout the top 50 markets. During Q1, 1,198 projects/190,475 rooms were in the renovation/conversion pipeline. There are over ten markets in the U.S. that currently have more than 15 substantial renovation and conversion projects underway. This group is led by Houston with 27 projects, Los Angeles, and New York, each with 22 projects, followed by Chicago, Miami, Phoenix, Washington DC, Atlanta, Dallas, Orlando, and Philadelphia.
In the first quarter of 2021, the top 50 markets saw 128 hotels/17,636 rooms open. LE is forecasting these same 50 markets to open another 367 projects/47,592 rooms over the next three quarters, for a total of 495 projects/65,228 rooms in 2021.
Related Stories
Market Data | Feb 17, 2016
AIA reports slight contraction in Architecture Billings Index
Multifamily residential sector improving after sluggish 2015.
Market Data | Feb 11, 2016
AIA: Continued growth expected in nonresidential construction
The American Institute of Architects’ semi-annual Consensus Construction Forecast indicates a growth of 8% in construction spending in 2016, and 6.7% the following year.
Market Data | Feb 10, 2016
Nonresidential building starts and spending should see solid gains in 2016: Gilbane report
But finding skilled workers continues to be a problem and could inflate a project's costs.
Market Data | Feb 9, 2016
Cushman & Wakefield is bullish on U.S. economy and its property markets
Sees positive signs for construction and investment growth in warehouses, offices, and retail
Market Data | Feb 5, 2016
CMD/Oxford forecast: Nonresidential building growth will recover modestly in 2016
Increased government spending on infrastructure projects should help.
Market Data | Feb 4, 2016
Mortenson: Nonresidential construction costs expected to increase in six major metros
The Construction Cost Index, from Mortenson Construction, indicated rises between 3 and 4% on average.
Contractors | Feb 1, 2016
ABC: Tepid GDP growth a sign construction spending may sputter
Though the economy did not have a strong ending to 2015, the data does not suggest that nonresidential construction spending is set to decline.
Data Centers | Jan 28, 2016
Top 10 markets for data center construction
JLL’s latest outlook foresees a maturation in certain metros.
Market Data | Jan 20, 2016
Nonresidential building starts sag in 2015
CDM Research finds only a few positive signs among the leading sectors.
Market Data | Jan 20, 2016
Architecture Billings Index ends year on positive note
While volatility persists, architecture firms reported healthy performance for 2015.


