


A record 10.7 billion rides were taken on public transit in the United States last year. And a national survey of Americans finds that the speed, reliability, and cost, more than any other factors, determine people’s willingness and frequency of use.
The survey of 11,842 adults in 46 Metropolitan Statistical Areas, 60% of whom live in “transit progressive” cities, also found that far more Americans want to live in mixed-use, walkable communities than actually do.
“That’s significant news, not just for planners, but for the real estate industry as well,” wrote David Bragdon, executive director of TransitCenter, a New York-based public policy and advocacy organization, which conducted the poll.
Bragdon asserted that, unlike other public utilities, mass transit is “personal,” and that receptivity to using mass transit is highly dependent on riders’ relationships with it in such areas as efficiency, cleanliness, proximity to stations, and how quickly they get to their destinations.
TransitCenter concluded that transit use is, ultimately, attitudinal. But this inference is a little quirky. Baby boomers who grew up in an era of mass-transit expansion are now far more resistant to using these systems than Millennials who “embrace” mass transit, said the survey.

Graphs courtesy TransitCenter
If you’re an ethnic minority, you are more likely to be a transit rider. Nearly two-fifths of African-Americans polled use mass transit at least once a week, and 22% use it three or four times a week. More than 30% of Hispanics ride buses and trains once a week, and one-fifth use these modes three or four times weekly. In contrast, only 10% of whites ride mass transit weekly, and only 5% use these modes more frequently.
The survey also found correlations between usage and income: high-income Americans are not big riders.
Some perceptions about transit use get debunked: for example, just because you’re a parent doesn’t mean you use transit systems less, although the survey found that parents aged 30 or younger are more positively inclined towards mass transit than older parents.
Students are frequent riders, but higher education is not much of a determining factor about who uses transit systems. That being said, a neighborhood’s employment rate certainly has a positive impact on rider frequency, and the survey found that employees are using transit benefits when their employers offer them.
The top predictor of use, according to the survey, is what kind of neighborhood the person lives in. While most respondents don’t seem to be clamoring to move back into their cities’ core, “many Americans are looking for something different” from their current living environments, Bragdon said. TransitCenter, in fact, sees “widespread demand” for walkable communities, even though most of the respondents aren’t living in these currently.


Related Stories

| Jul 18, 2014
Top Contractors [2014 Giants 300 Report]
Turner, Whiting-Turner, Skanska top Building Design+Construction's 2014 ranking of the largest contractors in the United States.

| Jul 18, 2014
Engineering firms look to bolster growth through new services, technology [2014 Giants 300 Report]
Following solid revenue growth in 2013, the majority of U.S.-based engineering and engineering/architecture firms expect more of the same this year, according to BD+C’s 2014 Giants 300 report.

| Jul 18, 2014
Top Engineering/Architecture Firms [2014 Giants 300 Report]
Jacobs, AECOM, Parsons Brinckerhoff top Building Design+Construction's 2014 ranking of the largest engineering/architecture firms in the United States.

| Jul 18, 2014
Top Engineering Firms [2014 Giants 300 Report]
Fluor, Arup, Day & Zimmermann top Building Design+Construction's 2014 ranking of the largest engineering firms in the United States.

| Jul 18, 2014
Top Architecture Firms [2014 Giants 300 Report]
Gensler, Perkins+Will, NBBJ top Building Design+Construction's 2014 ranking of the largest architecture firms in the United States.

| Jul 18, 2014
Top Architecture/Engineering Firms [2014 Giants 300 Report]
Stantec, HOK, and Skidmore, Owings & Merrill top Building Design+Construction's 2014 ranking of the largest architecture/engineering firms in the United States.

| Jul 18, 2014
2014 Giants 300 Report
Building Design+Construction magazine's annual ranking the nation's largest architecture, engineering, and construction firms in the U.S.
| Jul 17, 2014
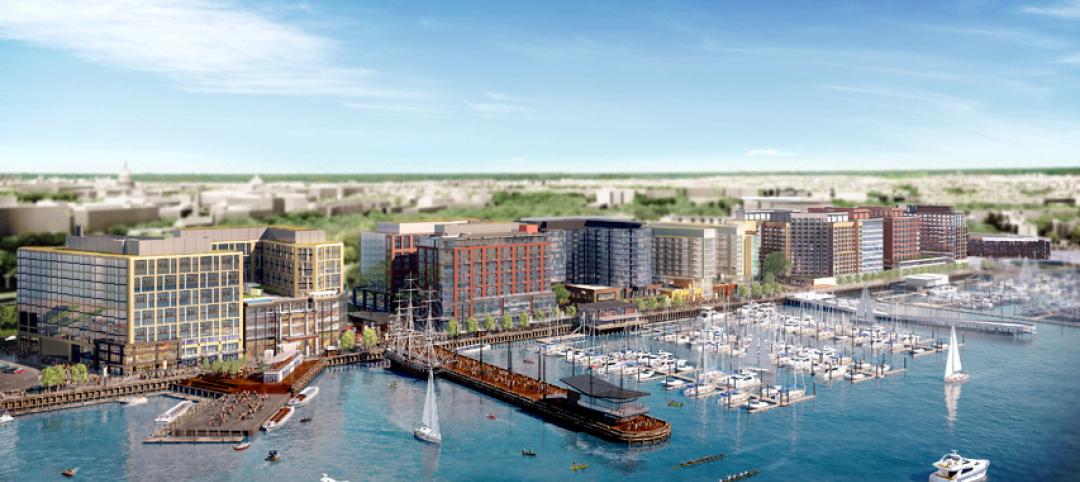
A new, vibrant waterfront for the capital
Plans to improve Washington D.C.'s Potomac River waterfront by Maine Ave. have been discussed for years. Finally, The Wharf has started its first phase of construction.
| Jul 17, 2014
A harmful trade-off many U.S. green buildings make
The Urban Green Council addresses a concern that many "green" buildings in the U.S. have: poor insulation.

| Jul 17, 2014
A high-rise with outdoor, vertical community space? It's possible! [slideshow]
Danish design firm C.F. Møller has developed a novel way to increase community space without compromising privacy or indoor space.


