

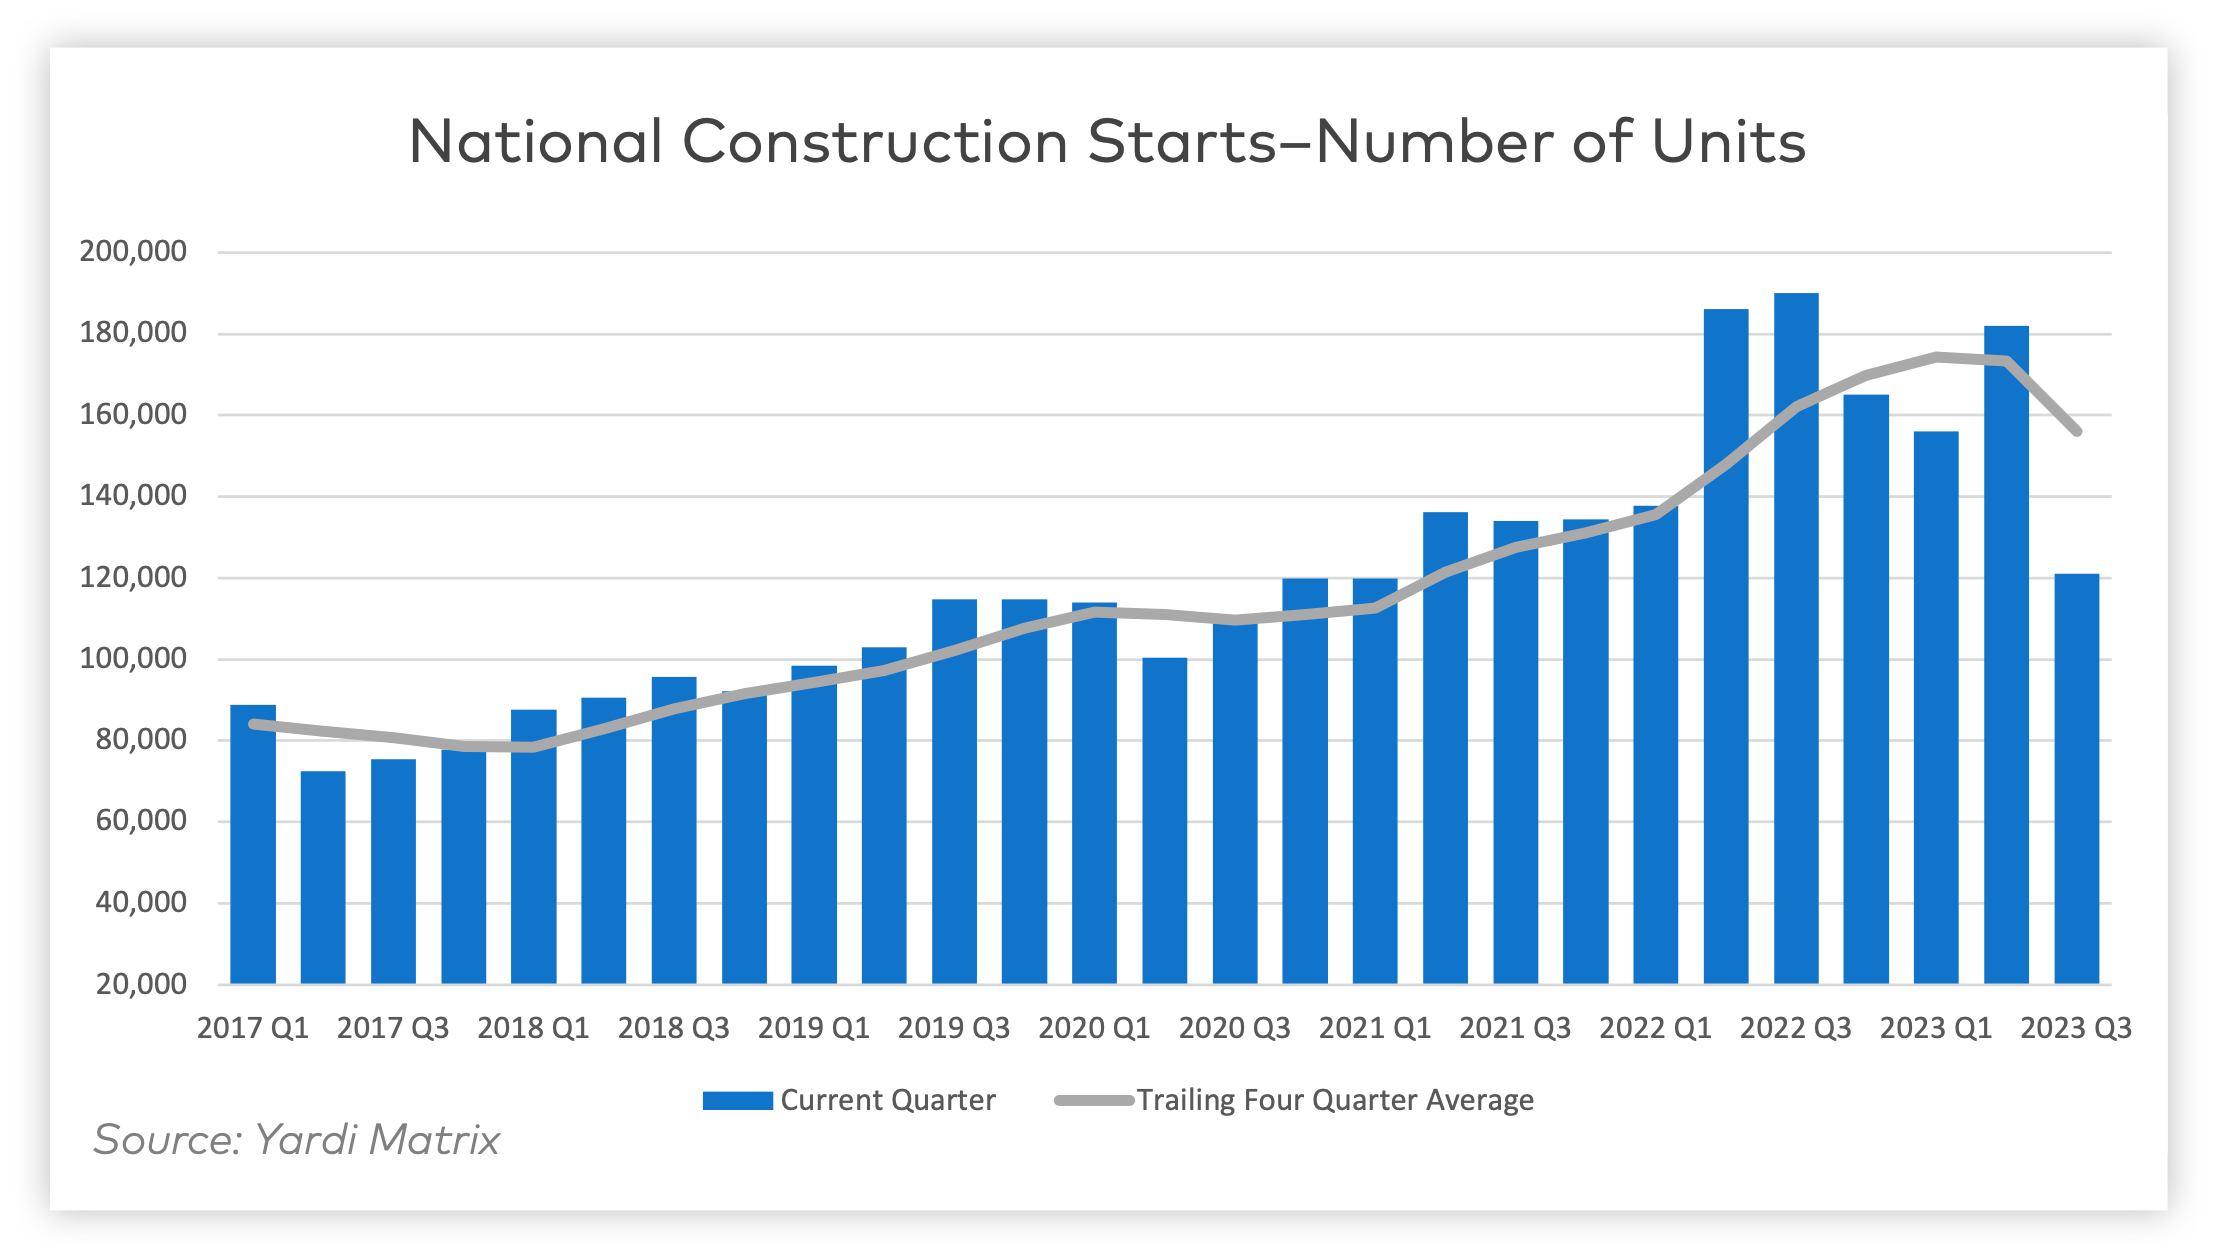
Despite a problematic financing environment, 2023 multifamily construction starts held up “remarkably well” according to the latest Yardi Matrix report. The data from 2023—albeit incomplete—shows that 506,742 units began construction. This figure ranks third for new construction starts even without the complete full year's data.
Yardi’s biggest takeaway is that multifamily development in 2023 exceeded initial expectations. This was driven in part by a “stronger-than-expected” Q1 and Q2, as well as an influx of affordable and single-family rental housing.
New Multifamily Development Insights
These are three insights from the Yardi Matrix Multifamily Construction Starts – January 2024 report:
1. Single-family rentals and affordable housing have become increasingly popular
For the last decade, the percentage of market rate multifamily units has declined in favor of other product types. While market rate units comprised 86% of all new multifamily construction starts in 2013, they now make up only 77% of the sector as of last year.
Conversely, affordable housing starts jumped from 8.4% to 13.4% of the total in ten years. Single-family rental increased from 0.9% to 5.8% in the same timeframe.
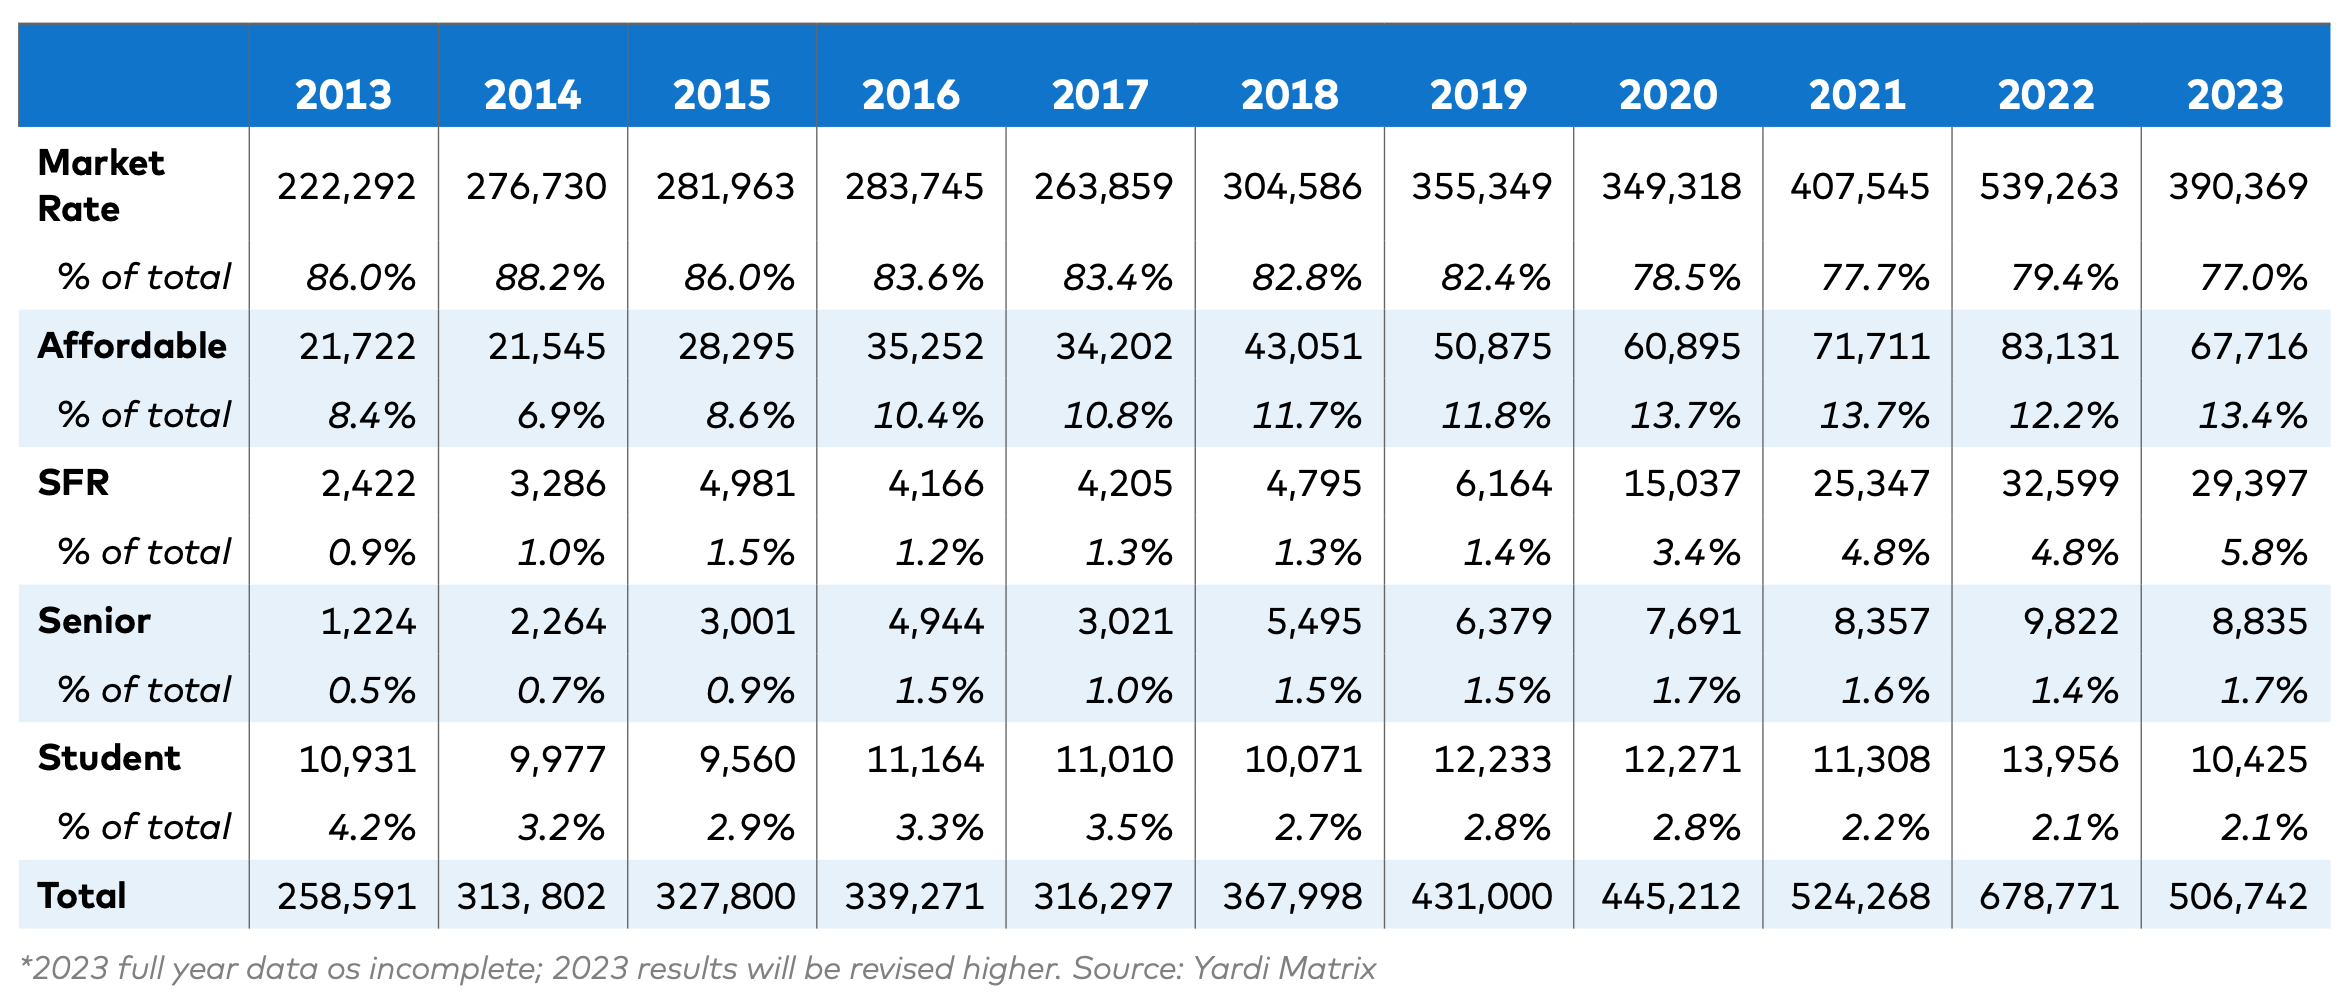
Senior housing has remained largely unchanged since 2013, increasing from 0.5% to 1.7%; student housing has been declining slowly, comprising 4.2% of multifamily construction starts in 2013 to 2.1% in 2023.
2. Markets with high levels of development in 2022 saw substantial declines in new construction starts in 2023
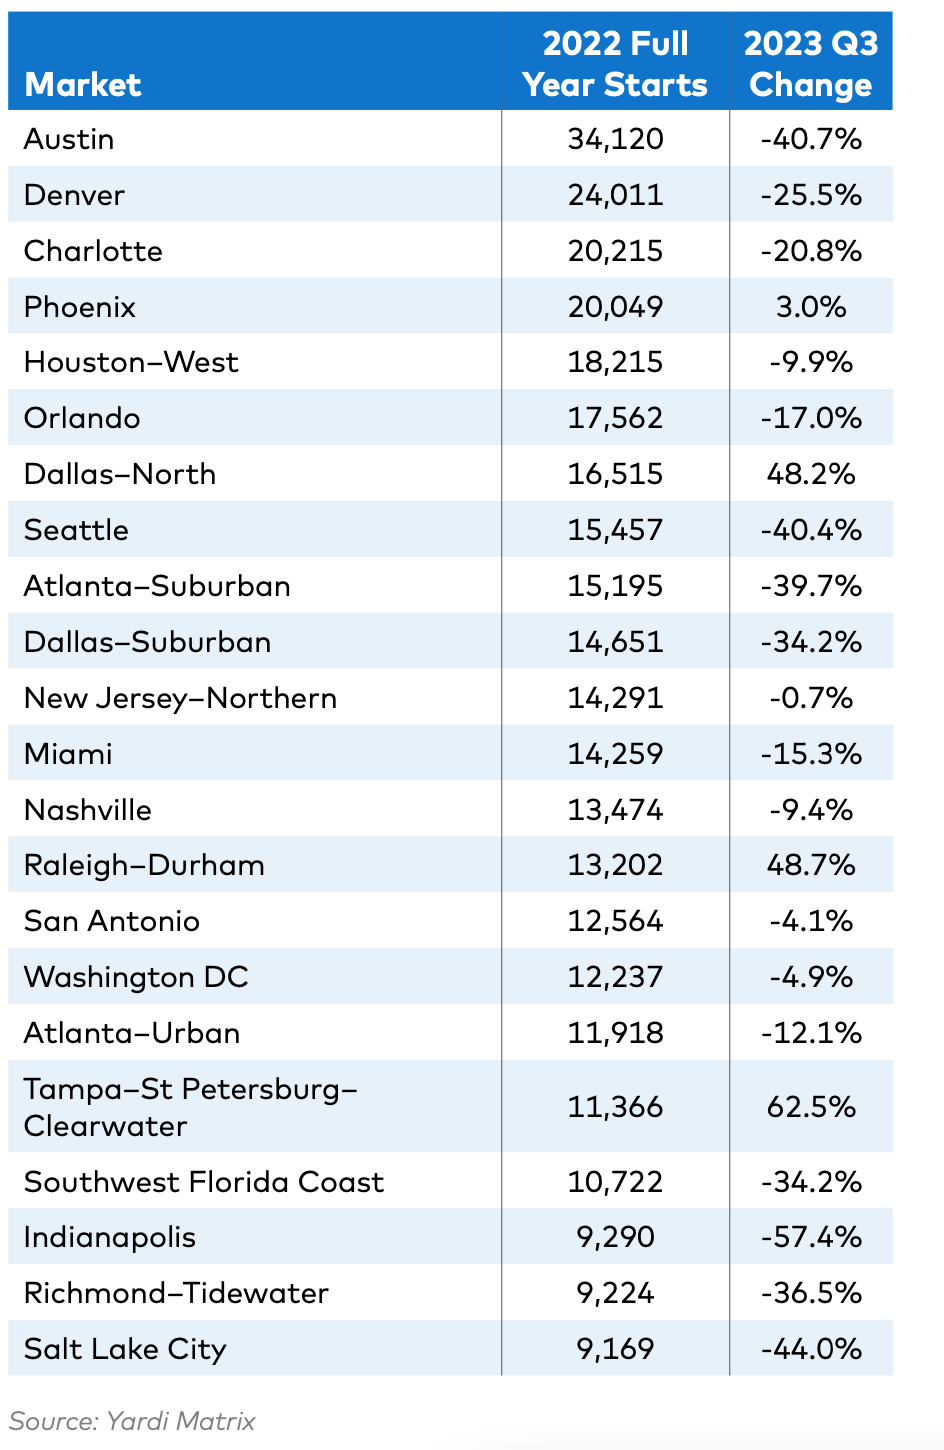
2022 saw 678,771 units start construction, a 29.4% increase over 2021 levels. Half of those were contained in just 22 markets. For the first three quarters of 2023, 18 of those markets saw starts decline compared to the same period in 2022.
Some of the more sizable declines in major metropolitan areas include:
- Salt Lake City, Utah, had a –44% change in multifamily starts from 2022
- Austin, Texas, had a –40.7% change in multifamily starts from 2022
- Seattle, Wash., had a –40.4% change in multifamily starts from 2022
Other markets like Southwest Florida Coast and suburban Atlanta, Dallas, and Denver saw starts decline by 25% or more.
3. Much of 2023’s new-development activity was driven by smaller and midsize markets
 According to the report, markets that did not participate in the post-pandemic development surge were better able to sustain new construction in 2023. These markets tended to be on the smaller size, averaging an increase of 2,161 units over the year.
Just four of the 22 strongest markets in 2022 continued to grow in 2023:
- Phoenix, Ariz., had a 3% growth in multifamily starts
- North Dallas, Texas, had a 48.2% growth in multifamily starts
- Raleigh–Durham, N.C., had a 48.7% growth in multifamily starts
- Tampa–St. Petersburg–Clearwater, Fla., had a 62.5% growth in multifamily starts
Other markets like Boston, Mass., (35%) and Kansas City, Mo., (41%) saw growth as well.
Bottom Line
Though slightly less than expected, new multifamily starts in 2023 are the 3rd highest year ever with 506,742 units. The growth primarily comes from affordable housing, single-family rentals, and smaller/midsize markets.
The decline this year is largely driven by tight financing conditions, and markets with high 2022 activity not being able to keep up. Despite the decline in starts, completions are expected to stay strong in 2024-2025.
Related Stories

Market Data | Dec 2, 2016
Nonresidential construction spending gains momentum
Nonresidential spending is now 2.6 percent higher than at the same time one year ago.

Market Data | Nov 30, 2016
Marcum Commercial Construction Index reports industry outlook has shifted; more change expected
Overall nonresidential construction spending in September totaled $690.5 billion, down a slight 0.7 percent from a year earlier.

Industry Research | Nov 30, 2016
Multifamily millennials: Here is what millennial renters want in 2017
It’s all about technology and convenience when it comes to the things millennial renters value most in a multifamily facility.
Market Data | Nov 29, 2016
It’s not just traditional infrastructure that requires investment
A national survey finds strong support for essential community buildings.

Industry Research | Nov 28, 2016
Building America: The Merit Shop Scorecard
ABC releases state rankings on policies affecting construction industry.

Market Data | Nov 17, 2016
Architecture Billings Index rebounds after two down months
Decline in new design contracts suggests volatility in design activity to persist.

Industry Research | Nov 8, 2016
Austin, Texas wins ‘Top City’ in the Emerging Trends in Real Estate outlook
Austin was followed on the list by Dallas/Fort Worth, Texas and Portland, Ore.

Industry Research | Nov 4, 2016
New survey exposes achievement gap between men and women designers
Female architects still feel disadvantaged when it comes to career advancement.

Market Data | Nov 2, 2016
Nonresidential construction spending down in September, but August data upwardly revised
The government revised the August nonresidential construction spending estimate from $686.6 billion to $696.6 billion.

Industry Research | Nov 1, 2016
Perkins Eastman Research releases white paper on ‘Centers for Healthy Living’ and whole-person wellness
Among the spotlight projects used as case studies for this white paper are C.C. Young, Dallas, Texas; Clark-Lindsey Village, Urbana, Ill.; Moorings Park, Naples, Fla.; NewBridge on the Charles, Dedham, Mass.; Rockwood Retirement Living: The Summit, Spokane, Wash.; Saint John’s on the Lake, Milwaukee, Wis.; and Spring Lake Village, Santa Rosa, Calif.


